
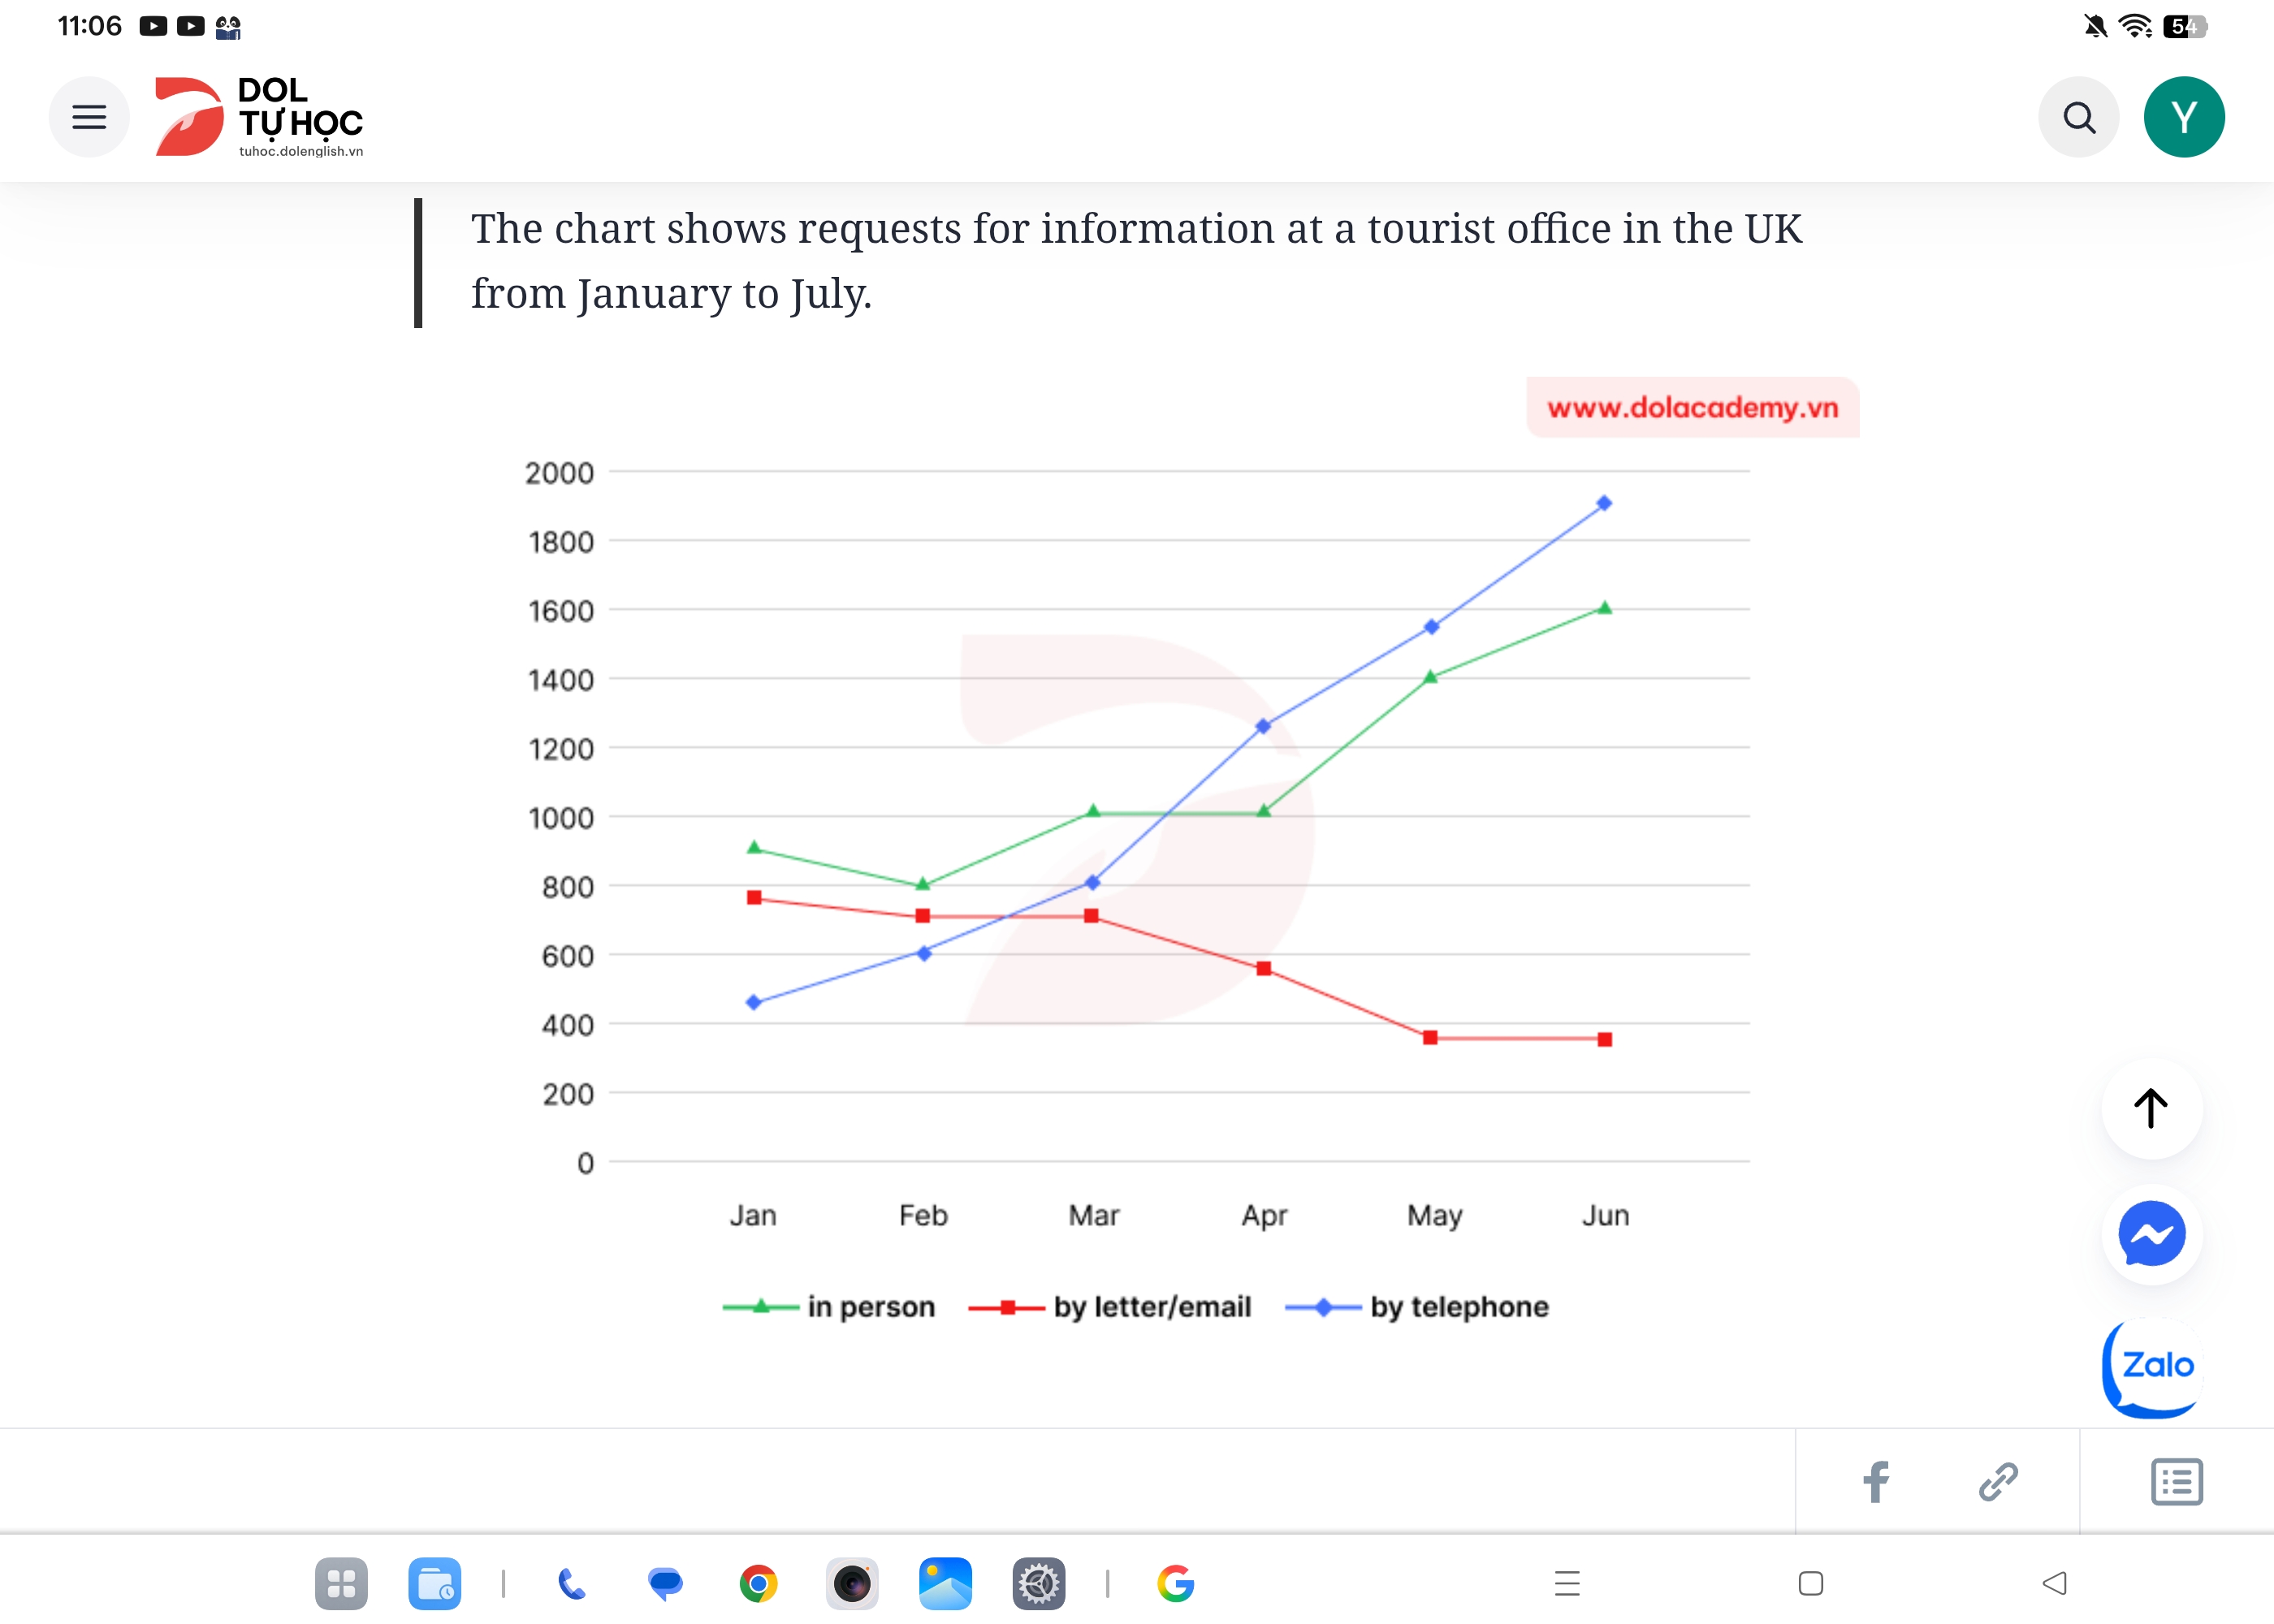
The line chart illustrates figure for information at a visitors center in the UK between January and July Overall, it is clear that on categories "in person" and " by telephone" witnessed an upward trend with the opposite was true for "by letter/email". In person saw a slight decrease from January to February and rise again in March. After that it remained stable at 1000 from March to April and continuing to June. At between April and May increased substantially 1000 to 1400. After starting gradual rise in June. For the number of tourists office using by telephone increased sharply and continuously approximately 400 to 2000 throughout the timeframe. But from January to March grew at a lower rate than it did in the later months By letter/e-mail fell slowly from January to March. And after that records decrease of 800 to under 400. Between May and June stood at approximately under 400
Detail Sampel
The chart shows requests for information at a tourist office in the UK from January to July
19/07/2026 05:42 5.5 skor
Topik
The chart shows requests for information at a tourist office in the UK from January to July
Jumlah kata: 153
Grafik/Diagram
Essay
Skor Keseluruhan
5.5±0.5
Dasar
Skor Kriteria Writing
TA5.0
CC6.0
LR6.0
GRA5.0
Task Achievement5.0
Target: 7.0
Kesalahan:1
Coherence & Cohesion6.0
Target: 7.0
Kesalahan:2
Lexical Resource6.0
Target: 7.0
Kesalahan:3
Grammar & Accuracy5.0
Target: 7.0
Kesalahan:0
Klik teks yang ditandai di esai untuk melihat saran detail untuk peningkatan.
Analisis mendalam
Task 1 - Academic Writing
4 tools available
Esai contoh - IELTS Writing Task 1
Belum ada esai contoh
Silakan klik tombol di bawah untuk menganalisis dan membuat esai contoh berkualitas tinggi untuk Task 1.