
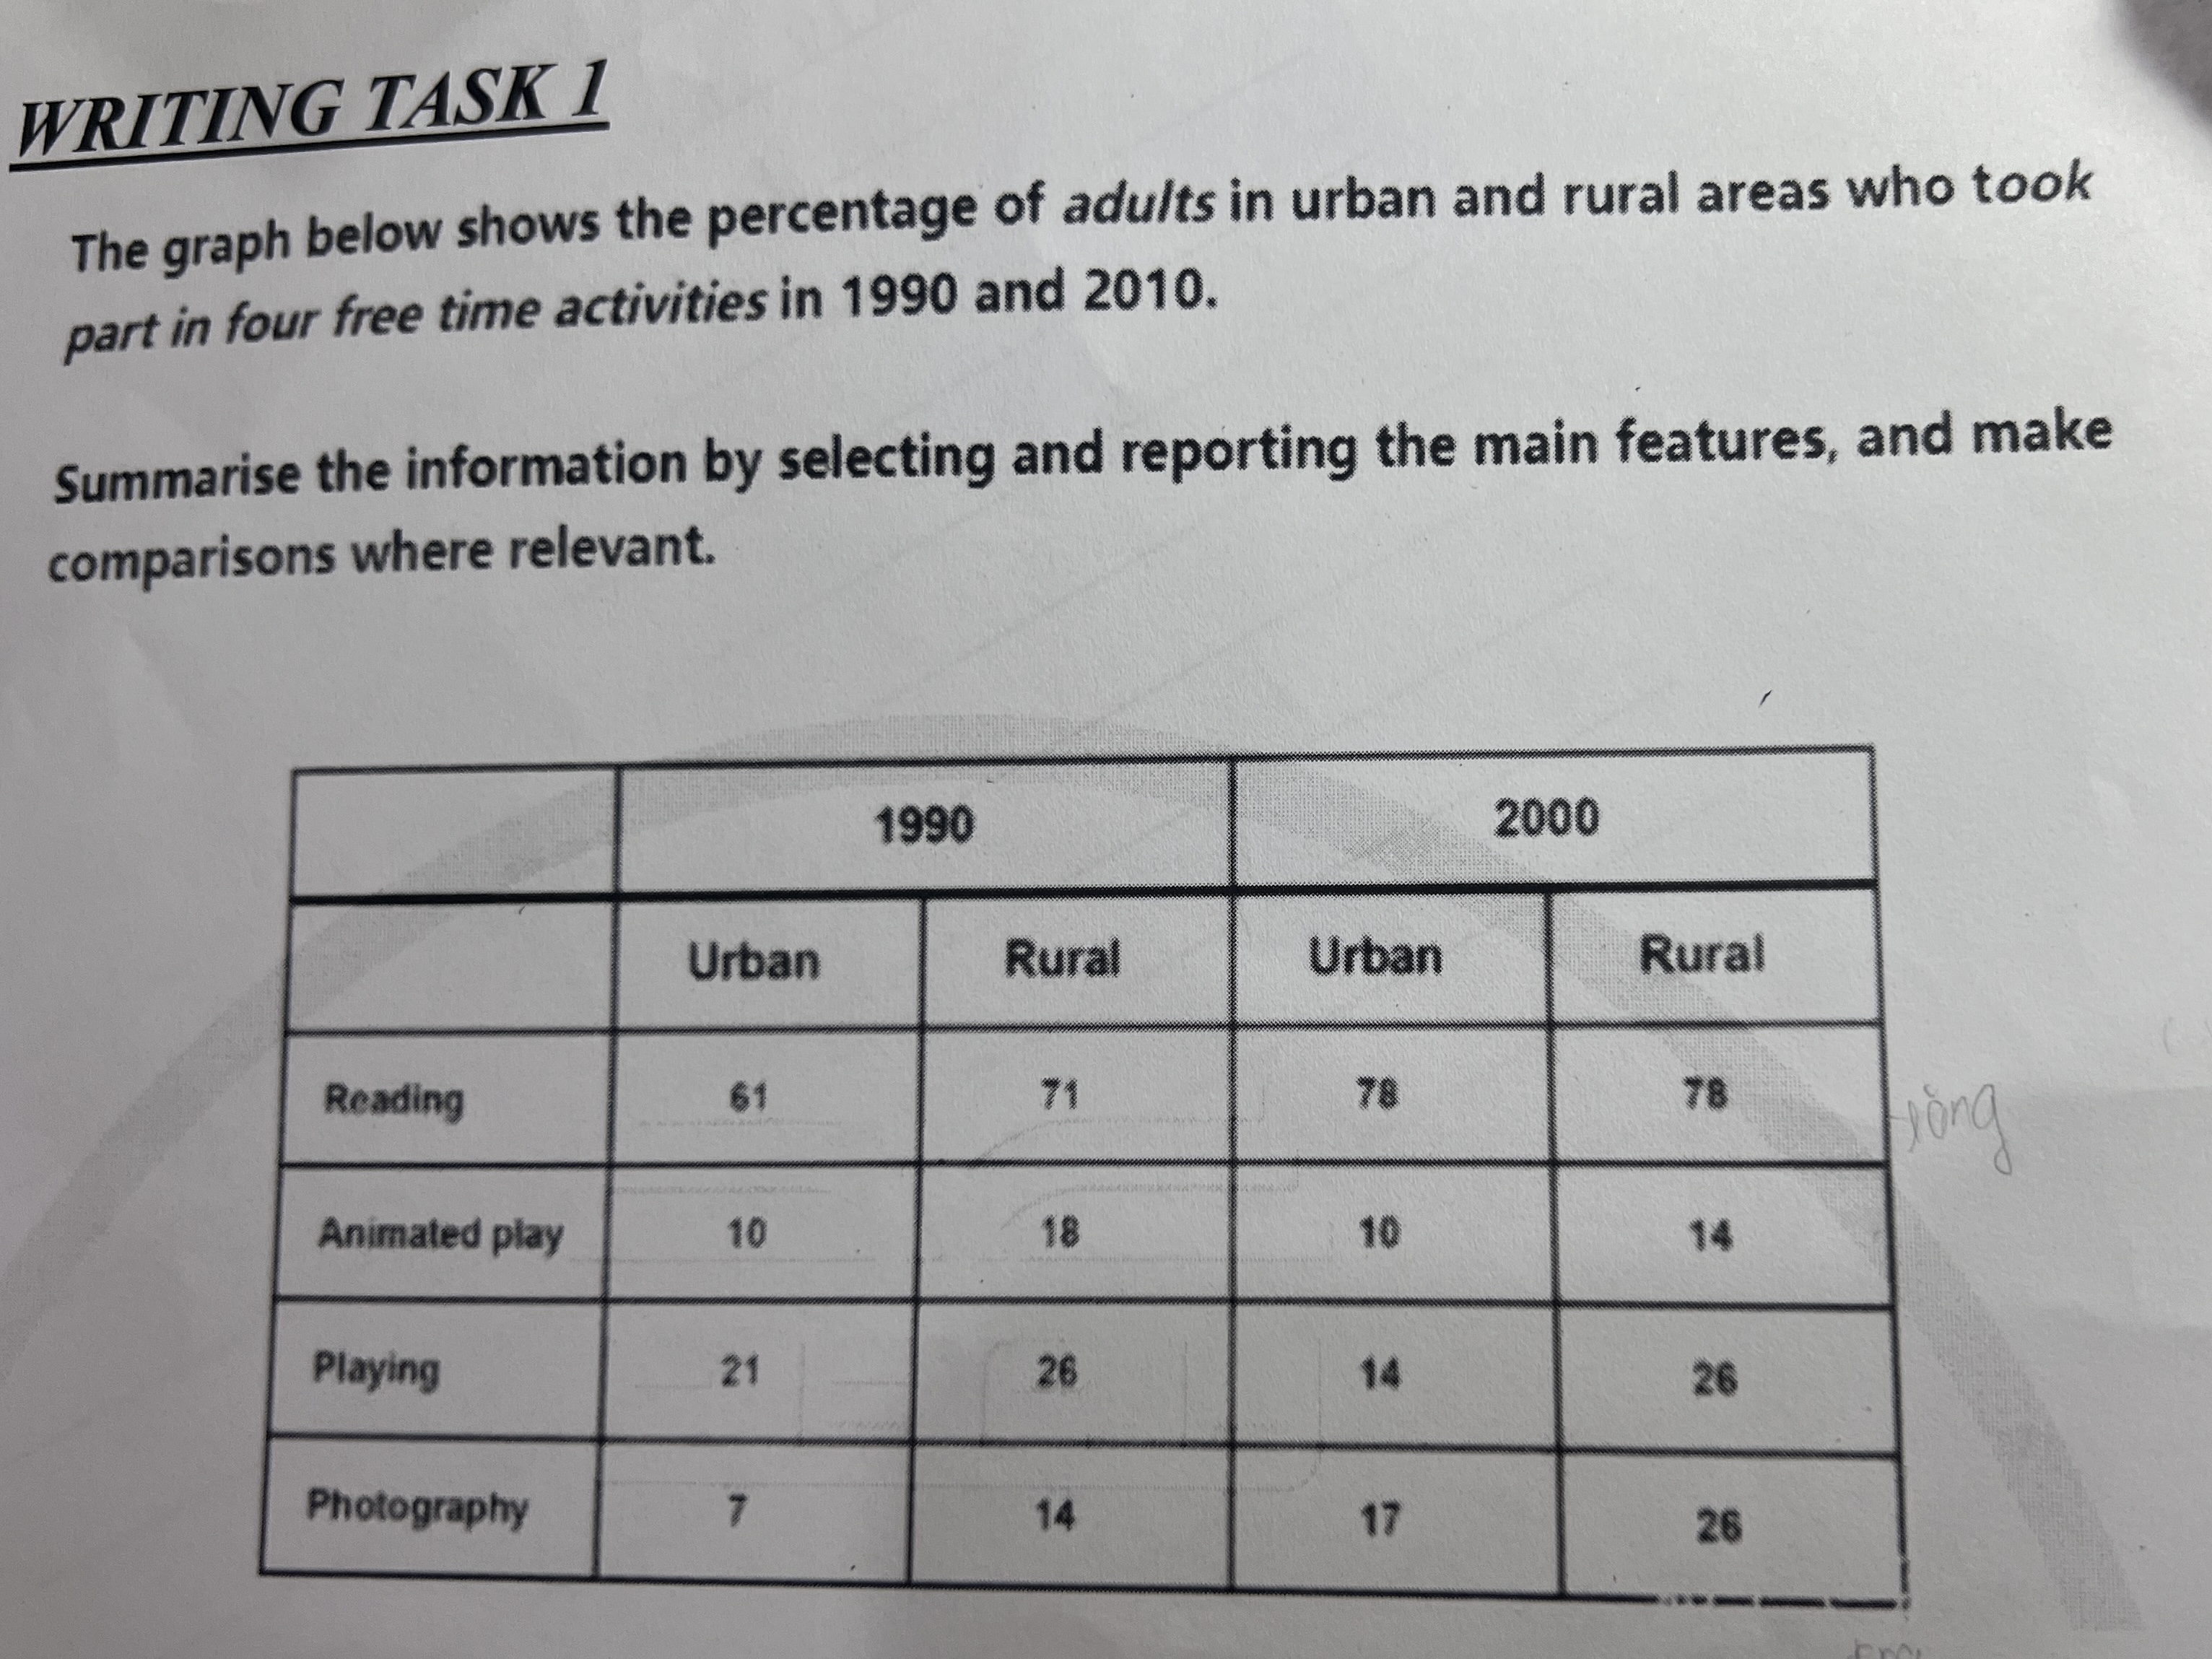
The table compares how adults in city and countryside involved in four leisure time activities between 1990 adn 2000. Overall, there was an growth in two free-time habits after a decade, reading and phothograph , while animated play and playing generally declined or maintain unchanged. Noticebly, the most predominance pastime in both years was reading. In 1990, the percentage of urban readers was stood at about 61%, and that of rural-region readers was 71%. However, this gap was broken down in 2000, when both figures witnessed a increase to 78%. Also, the proportions of urban and countriside photographers only began at respectively 7% and 14% in 1990, after which relatively doubled to 17% and 26% in 2000. The participation of urban aldults in animated play remained untouched at 10% after a decade, wherease the engagement in the countriside audiences dropped form 18% to 14%. Conversely, this partern was reversed in playing activities. In this section, urban participants sharply fell from 21% to only 14%, while the rural ones stabilized at 26% in after the 10-year period
Detail Sampel
The graph below shows the percentage of adults in urban and rural areas who took part in four free time activities in 1990 and 2010.
19/07/2026 06:07 6.0 skor
Topik
The graph below shows the percentage of adults in urban and rural areas who took part in four free time activities in 1990 and 2010.
Jumlah kata: 176
Grafik/Diagram
Essay
Skor Keseluruhan
6.0±0.5
Cukup
Skor Kriteria Writing
TA6.0
CC7.0
LR5.0
GRA6.0
Task Achievement6.0
Target: 7.0
Kesalahan:0
Coherence & Cohesion7.0
Target: 7.0
Kesalahan:2
Lexical Resource5.0
Target: 7.0
Kesalahan:17
Grammar & Accuracy6.0
Target: 7.0
Kesalahan:0
Klik teks yang ditandai di esai untuk melihat saran detail untuk peningkatan.
Analisis mendalam
Task 1 - Academic Writing
4 tools available
Esai contoh - IELTS Writing Task 1
Belum ada esai contoh
Silakan klik tombol di bawah untuk menganalisis dan membuat esai contoh berkualitas tinggi untuk Task 1.