
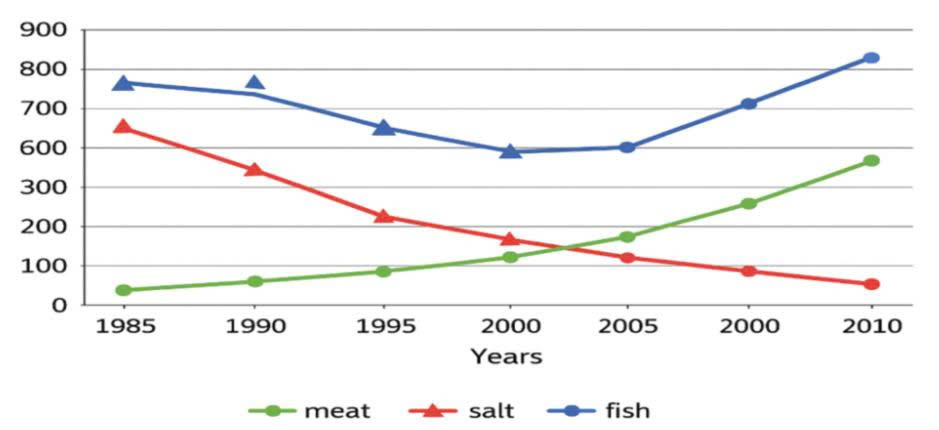
The chart illustrates the changes in food consumption by Chinese people from 1985 to 2010. Overall, there were an increasing trend in meat throughout the years while salt is seen an downard trend in Chinese people's consumption. The changes in fish consumption saw a dip slightly. The number of meat consumption started stood at approximately 50 in 1985 was the lowest figure while fish consumption experienced the highest figure with 750. Although, they had a similar upward trend in 2010 with meat consumption jumped about 600 and fish consumption reach a peak of the chart with 820. In 1985, salt consumption compared to meat consumption just fluctuations slightly. Started at 650 but later it had a plunge before reaching the lowest point about 50 in 2010 which was equal to the meat consumption in 1985.
Sample Detail
The graph below shows the changes in food consumption by Chinese people between 1985 and 2010.
19/07/2026 06:26 5.0 points
Topic
The graph below shows the changes in food consumption by Chinese people between 1985 and 2010.
Word count: 135
Chart/Graph
Essay
Overall Scores
5.0±0.5
Basic
Writing Criteria Scores
TA5.0
CC5.0
LR5.0
GRA5.0
Task Achievement5.0
Target: 7.0
Errors:1
Coherence & Cohesion5.0
Target: 7.0
Errors:3
Lexical Resource5.0
Target: 7.0
Errors:3
Grammar & Accuracy5.0
Target: 7.0
Errors:0
Click on any highlighted text in the essay to view detailed suggestions for improvement.
Deep Analysis
Task 1 - Academic Writing
4 tools available
Sample Essay - IELTS Writing Task 1
No sample essay
Click the button below to analyze and generate a high-quality sample essay for Task 1.