
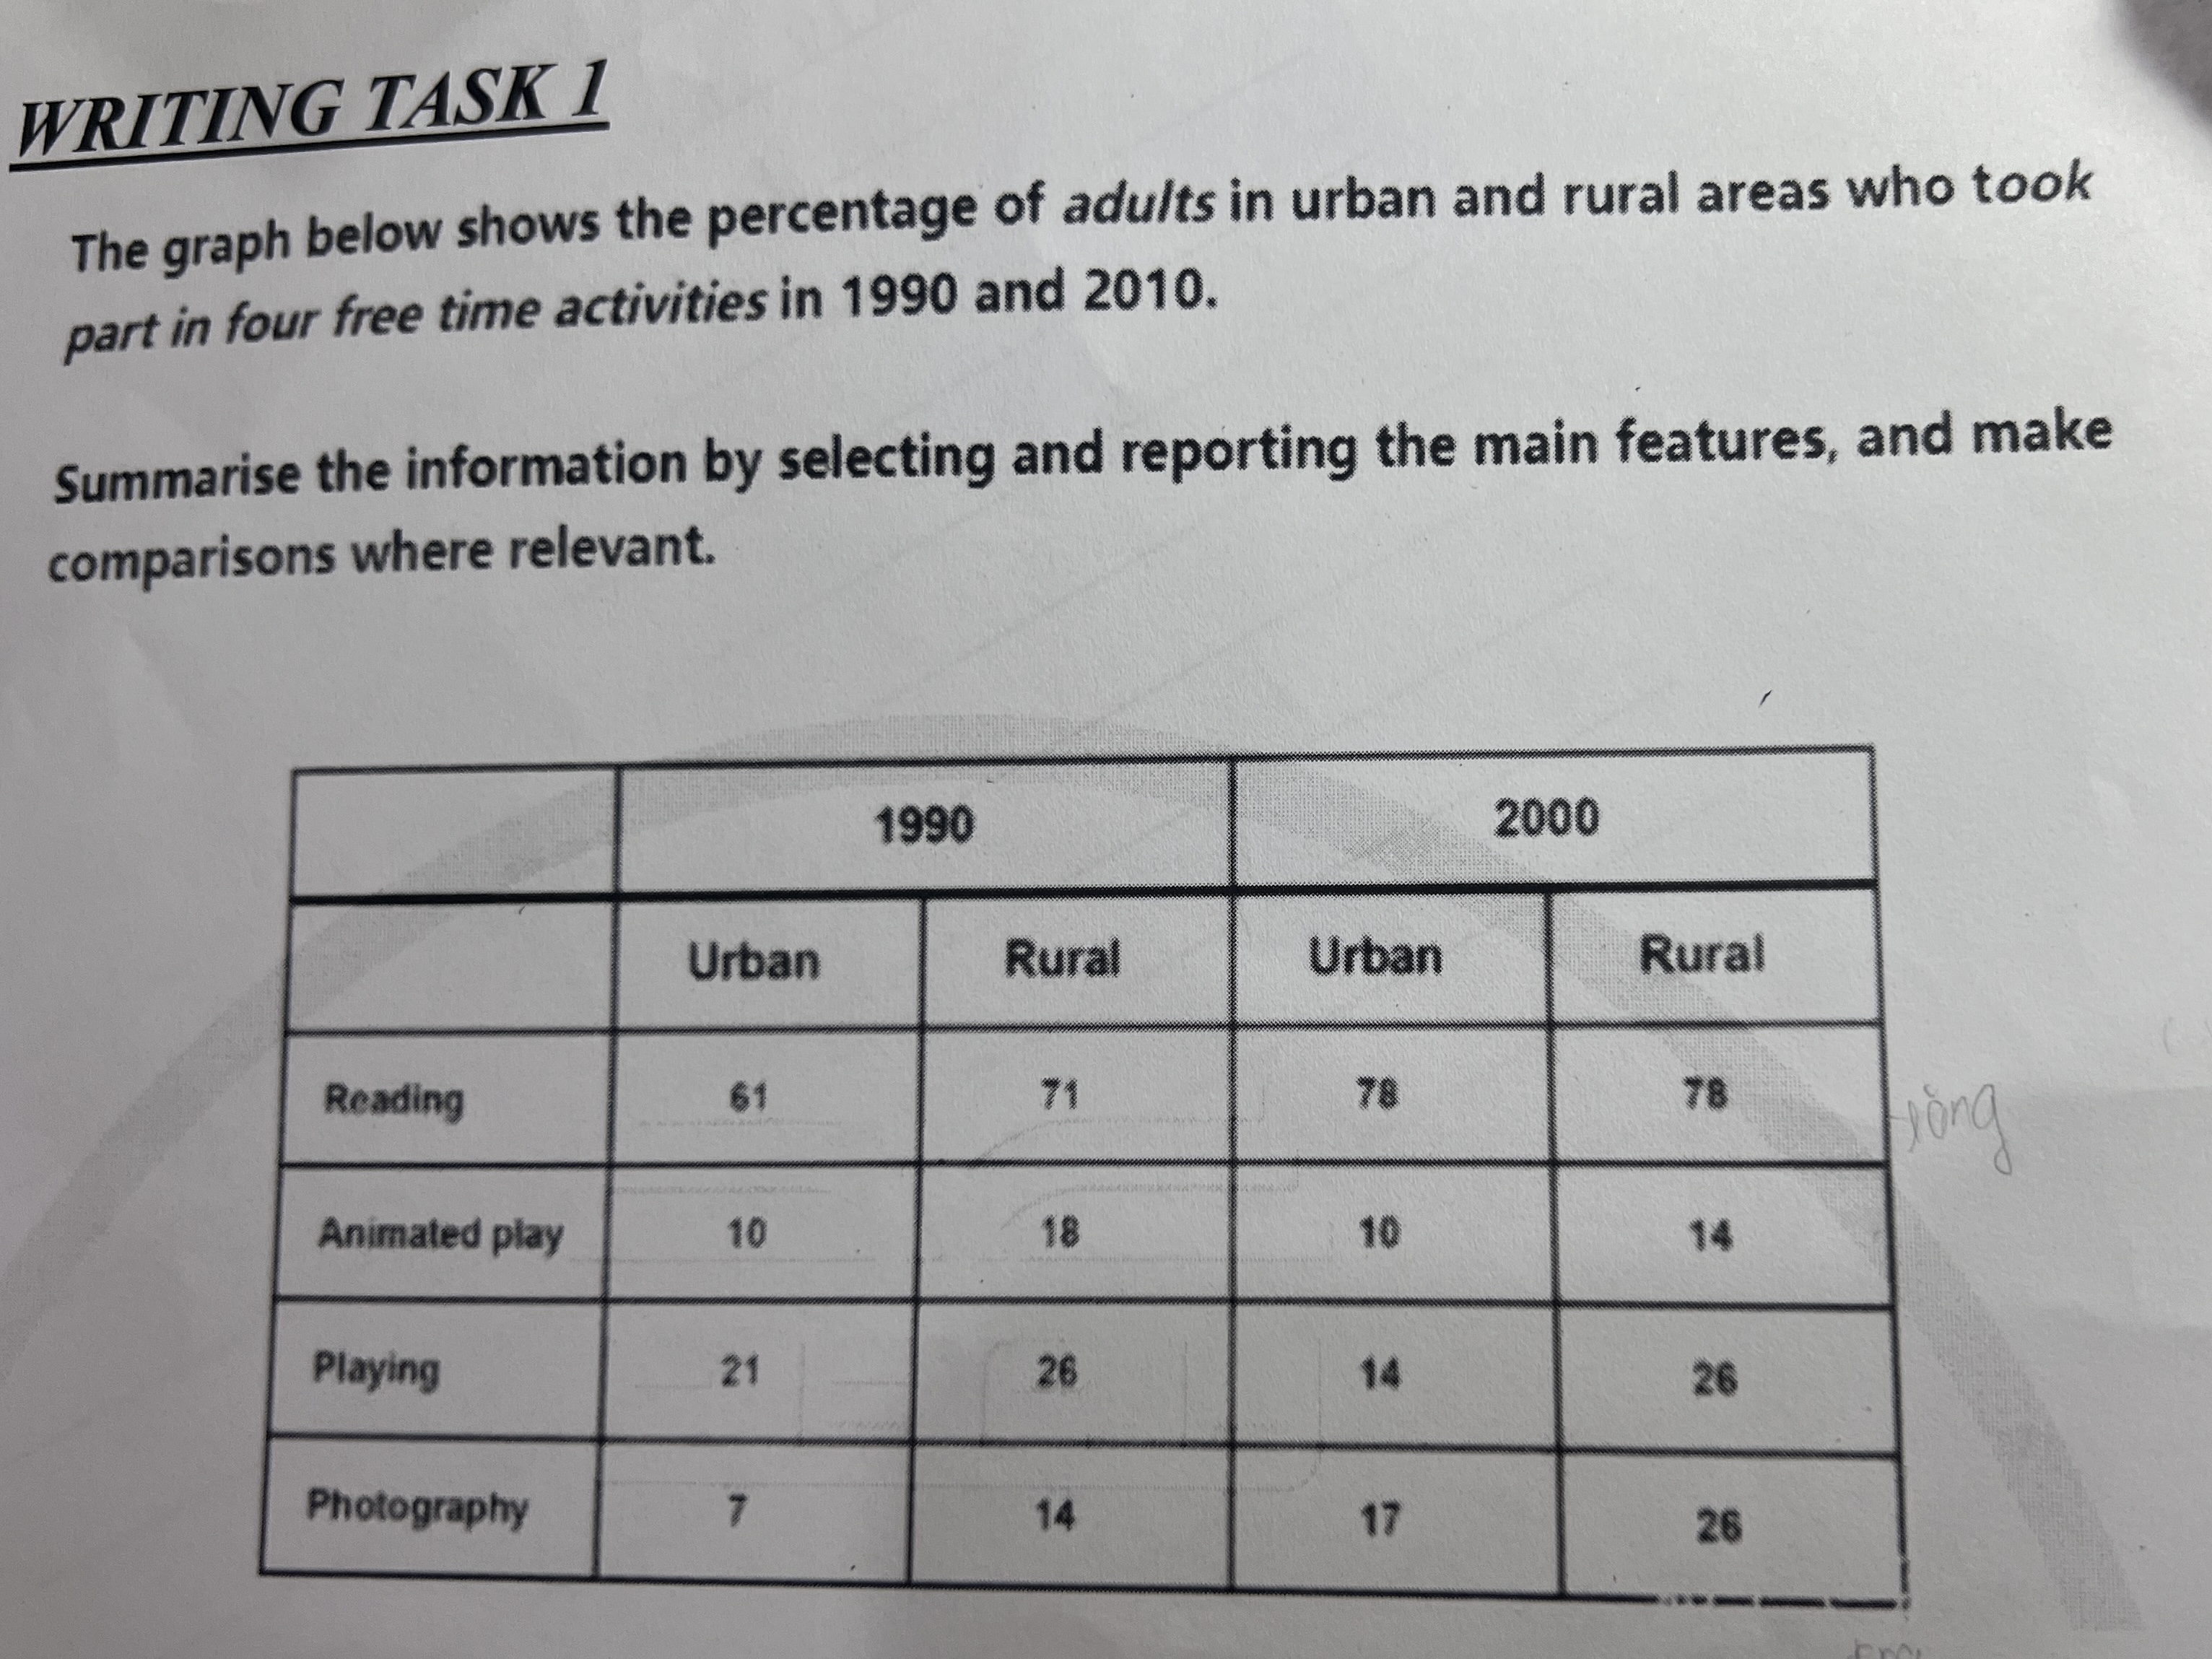
The table compares how urban city and countryside aldults participated in four leisure activities between 1990 and 2000. Overall, the participation of rural people in free time habits was generally higher than that of urban citizens. Significantly, in both years reading remained its predominance in two categories of subjectives. In 1990, the percentage of urban readers was only about 61% lesser than the figure for rural ones at 72%. However, by 2000, this gap was closed after the a growth recorded at both figures to 78%. Also, the proportion of urban and rural photographers also double from resepctively 7% and 14% to relatively 17% and 26% after a decade. The percentage of urban audience for animated play stood at around 10% in 1990, after which remained stable by 2000, as opposed to the decline in the figure for rural audiences from 18% to only 14%. Conversely, this pattern in playing was reversed. Regarding the playing activities, the participation of the urban people declined from 21% in 1990 to only 14% in 2000, whereas the engagement of the countryside individuals maintain unchanged at 26% in both years.
รายละเอียดตัวอย่าง
The graph below shows the percentage of adults in urban and rural areas who took part in four free time activities in 1990 and 2010.
19/07/2026 06:33 6.0 คะแนน
หัวข้อ
The graph below shows the percentage of adults in urban and rural areas who took part in four free time activities in 1990 and 2010.
จำนวนคำ: 186
แผนภูมิ/กราฟ
Essay
คะแนนรวม
6.0±0.5
ดีพอใช้
คะแนนเกณฑ์การเขียน
TA6.0
CC7.0
LR6.0
GRA6.0
Task Achievement6.0
เป้าหมาย: 7.0
ข้อผิดพลาด:0
Coherence & Cohesion7.0
เป้าหมาย: 7.0
ข้อผิดพลาด:1
Lexical Resource6.0
เป้าหมาย: 7.0
ข้อผิดพลาด:2
Grammar & Accuracy6.0
เป้าหมาย: 7.0
ข้อผิดพลาด:0
คลิกข้อความที่ไฮไลต์ในเรียงความเพื่อดูคำแนะนำรายละเอียดเพื่อพัฒนา
การวิเคราะห์เชิงลึก
Task 1 - Academic Writing
4 tools available
บทความตัวอย่าง - IELTS Writing Task 1
ยังไม่มีบทความตัวอย่าง
กดปุ่มด้านล่างเพื่อวิเคราะห์และสร้างบทความตัวอย่างคุณภาพสูงสำหรับ Task 1