
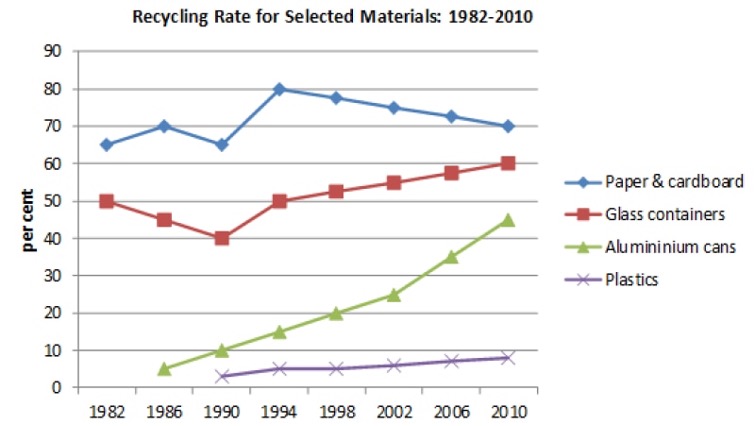
The given line chart illustrates the percentage of recycle products such as Paper & carboard, Glass containers, aluminum cans and plastics from 1982 to 2010. Overall, in 1982 the rate recycles of Paper and carboard was the largest category, making up the largest share. During the period shown, the rate recycles of plastics was the lowest proportion. Moreover, the percentage of aluminum cans for material was surged dramatically. The recycling rate for paper & cardboard fluctuated during the starting period, rising from 65% in 1982 to 70% in 1986, before falling back to 67% in 1990. Then, it reached a peak of 80% in 1994. After that, which was sightly decreased to 70 in 2010. The figure for glass containers also fluctuated, decreasing from 50% in 1982 to a low of 40% in 1990. Then it increased steadily, climbing to 60% by the end of the period. Initially, aluminium cans and plastics provided negligible recycling rates of 5% in 1986 and 2% in 1990, respectively. Over the whole period, plastic products rose slightly from 5% to 10%. By contrast, the production of aluminum cans grew rapidly and reached a peak of 48% in 2010.
Detail Sampel
The maps below show a beachfront area in Australia in 1950 and today.
19/07/2026 06:46 5.5 skor
Topik
The maps below show a beachfront area in Australia in 1950 and today.
Jumlah kata: 194
Grafik/Diagram
Essay
Skor Keseluruhan
5.5±0.5
Dasar
Skor Kriteria Writing
TA6.0
CC6.0
LR5.0
GRA6.0
Task Achievement6.0
Target: 7.0
Kesalahan:0
Coherence & Cohesion6.0
Target: 7.0
Kesalahan:2
Lexical Resource5.0
Target: 7.0
Kesalahan:4
Grammar & Accuracy6.0
Target: 7.0
Kesalahan:0
Klik teks yang ditandai di esai untuk melihat saran detail untuk peningkatan.
Analisis mendalam
Task 1 - Academic Writing
4 tools available
Esai contoh - IELTS Writing Task 1
Belum ada esai contoh
Silakan klik tombol di bawah untuk menganalisis dan membuat esai contoh berkualitas tinggi untuk Task 1.