
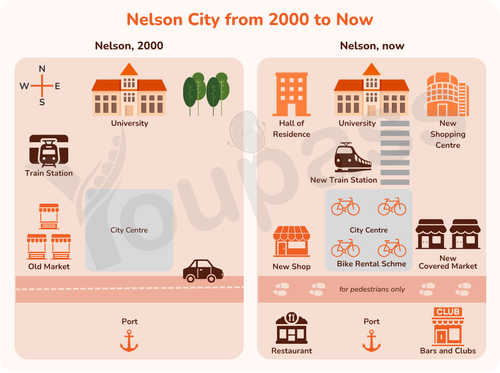
The image illustrates the development of Nelson City between 2000 and now. Overall, the city centre changed greatly, moving from a residential city to a more commercial destination. While some features, such as the university and port, are kept, most of the elements are replaced with a more modern version, making the city attractive to visitors as well as improving the residents' quality of life. In 2000, the city was bounded on the south by a highway designated for cars. To the north was a large university, and a forest to the east of the university. The train station stood to the west, while the old market was situated in the southwest. On the other side of the highway was the port, opposite the city centre. Overall, the centre served as a residential area, with less entertainment. In contrast, Nelson City today has been significantly redeveloped to encourage more visitors. The university is maintained, while the forest has been removed and replaced by a new shopping centre. There is a new road connecting the university and the city centre, and the train station has been relocated near the new road and replaced by a new one. There is also a hall of residence in the northwest, near the university. On the south side, near the city centre, the old market has disappeared and has been replaced by a new shop, and there is an additional covered market to the east of the city centre. Meanwhile, the city centre has been updated to include a bike rental scheme. On the other side of the pedestrian road, there is a new restaurant to the west of the port, and an entertainment place including bars and clubs on the opposite side.
Detail Sampel
The maps showed the changes in a city centre from the year 2000 to the present day. Summarise the information by selecting and reporting the main features, and make comparisons where relevant.
19/07/2026 06:55 7.0 skor
Topik
The maps showed the changes in a city centre from the year 2000 to the present day. Summarise the information by selecting and reporting the main features, and make comparisons where relevant.
Jumlah kata: 288
Grafik/Diagram
Essay
Skor Keseluruhan
7.0±0.5
Baik
Skor Kriteria Writing
TA7.0
CC7.0
LR7.0
GRA7.0
Task Achievement7.0
Target: 7.0
Kesalahan:1
Coherence & Cohesion7.0
Target: 7.0
Kesalahan:2
Lexical Resource7.0
Target: 7.0
Kesalahan:3
Grammar & Accuracy7.0
Target: 7.0
Kesalahan:0
Klik teks yang ditandai di esai untuk melihat saran detail untuk peningkatan.
Analisis mendalam
Task 1 - Academic Writing
4 tools available
Esai contoh - IELTS Writing Task 1
Belum ada esai contoh
Silakan klik tombol di bawah untuk menganalisis dan membuat esai contoh berkualitas tinggi untuk Task 1.