
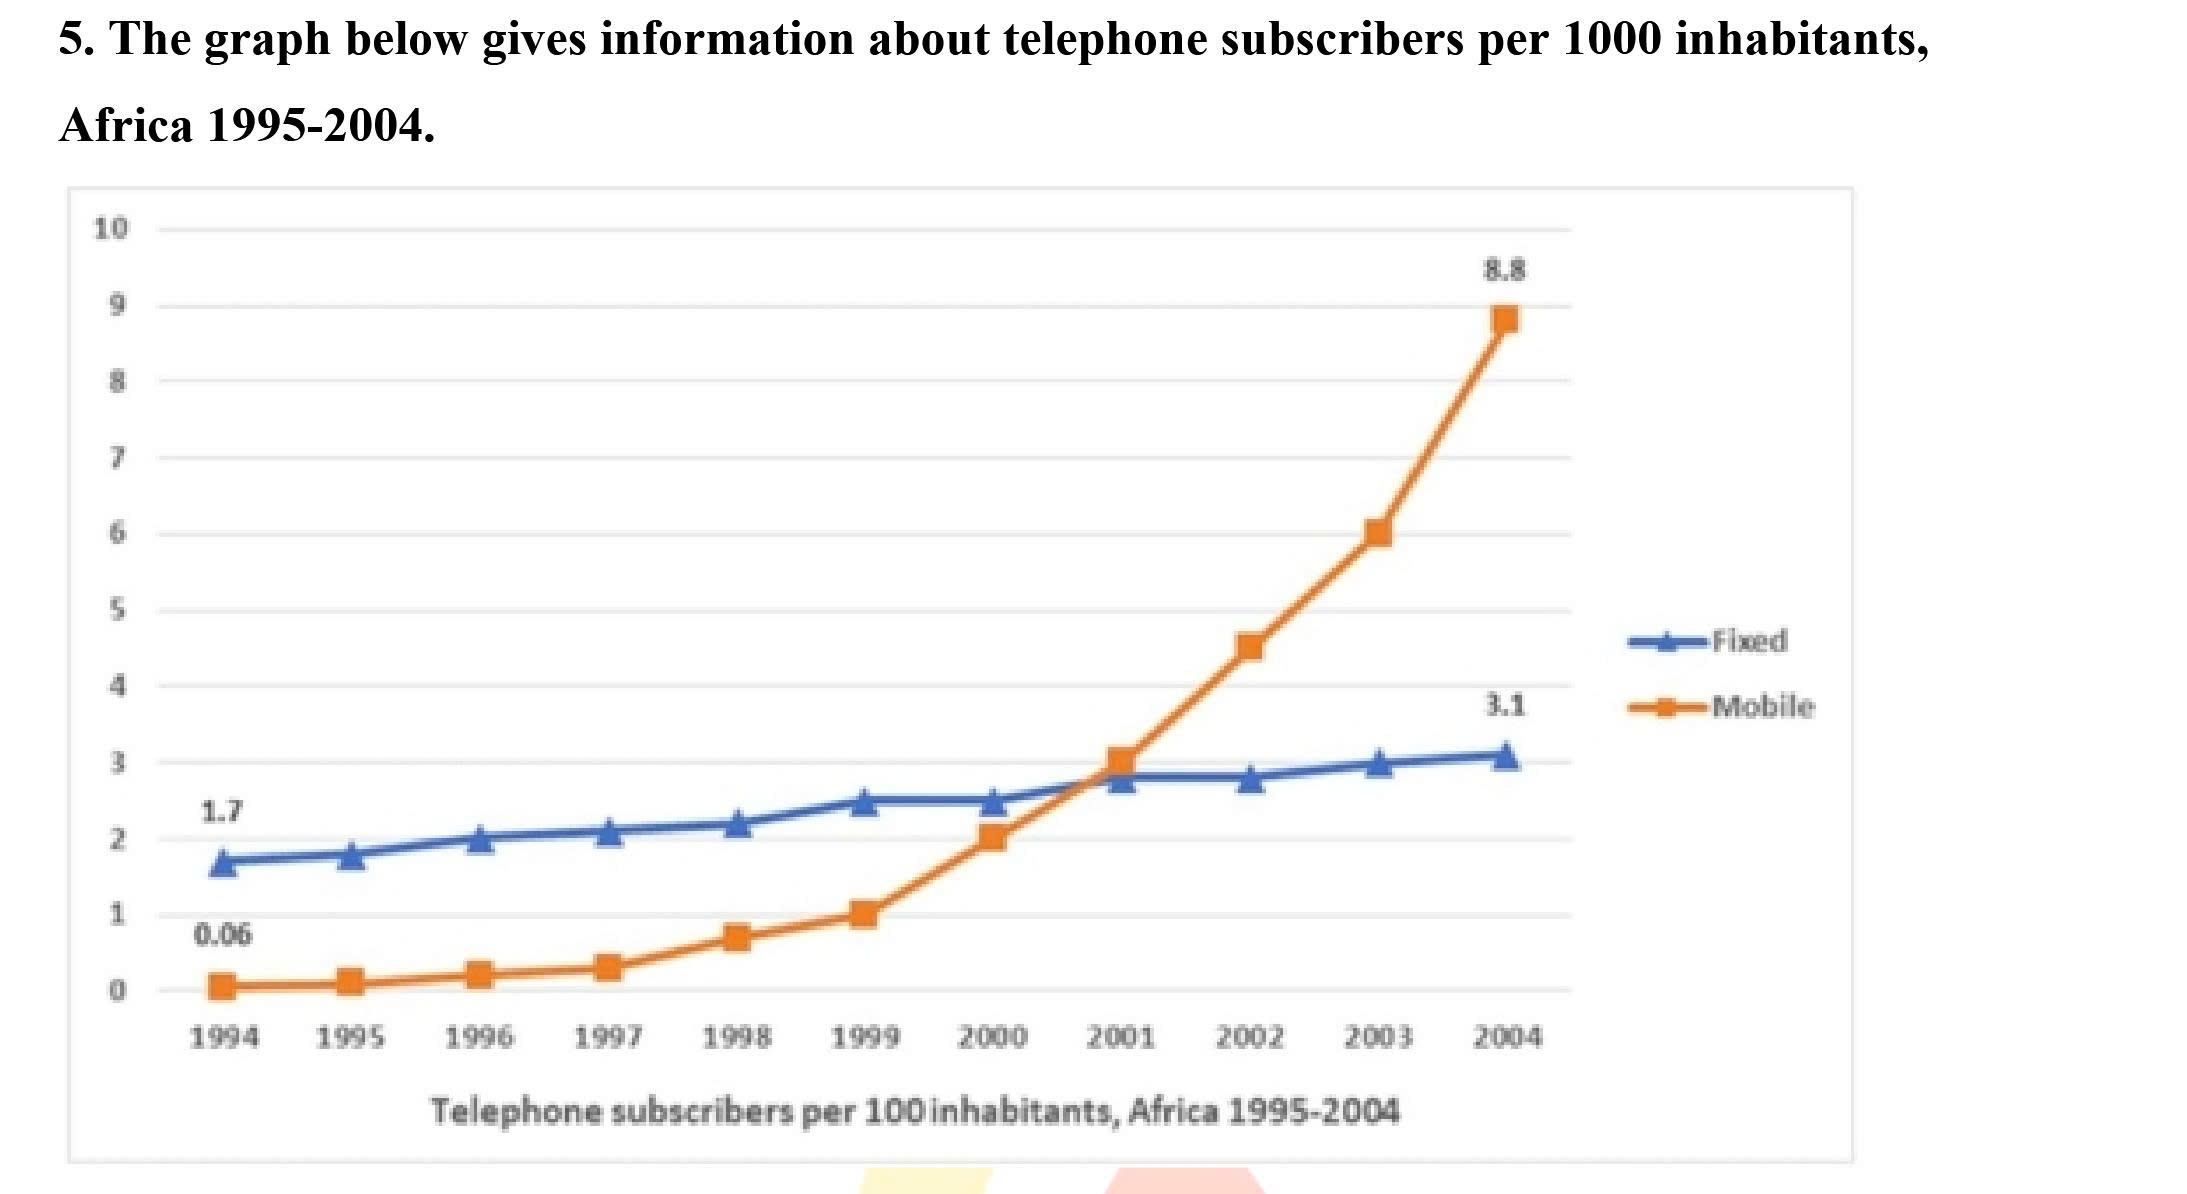
The line graph illustrates the number of fixed telephone and mobile subscribers per 1000 inhabitants in Africa over a 11-year period, starting from 1994. Overall, what is most striking when looking at the chart is that while the fixed-telephone-subscribers ratios consistently recorded higher figures in the first seven years, they were surpassed by the figures for mobile users until the end of the period. Another noticeable point is that while both categories witnessed an upward trajectory, mobile subscribers showed a more drastic increase. Focusing on fixed telephone subscribers, in 1994, the figure stood at 1.7, which was almost thirty times higher than that of its mobile counterparts, standing at 0.06. Then, the fixed-telephone users ratio continued to steadily rise above its initial points until 2001. At this point, it was exceeded by the mobile-users ratio. Despite this change, it remained relatively stable until 2002, standing at around 2.90, and then rose to its peak at 3.1 at the end of the period in 2004. In the mobile subscribers category, the figure had a modest start at around 0.06 and remained relatively unchanged until 1995, which was significantly lower than that of the fixed telephone users. Then, it continued to increase, reaching 1.00 in 1999. From there, a much more significant increase was seen, with the figure climbing drastically to around 3.00 in 2001, which was 50 times higher than its initial point and managed to exceed the ratio for fixed telephone users. Notably, it rose swiftly to 6.0 in 2003, and then reached its peak at 8.8 in the last year. This was also the highest figure recorded on the chart, far surpassing all of the aforementioned ratios.
รายละเอียดตัวอย่าง
The graph below gives information about telephone subscribers per 1000 inhabitants in Africa 1995-2004.
19/07/2026 07:04 7.0 คะแนน
หัวข้อ
The graph below gives information about telephone subscribers per 1000 inhabitants in Africa 1995-2004.
จำนวนคำ: 278
แผนภูมิ/กราฟ
Essay
คะแนนรวม
7.0±0.5
ดีมาก
คะแนนเกณฑ์การเขียน
TA7.0
CC7.0
LR7.0
GRA7.0
Task Achievement7.0
เป้าหมาย: 7.0
ข้อผิดพลาด:0
Coherence & Cohesion7.0
เป้าหมาย: 7.0
ข้อผิดพลาด:1
Lexical Resource7.0
เป้าหมาย: 7.0
ข้อผิดพลาด:2
Grammar & Accuracy7.0
เป้าหมาย: 7.0
ข้อผิดพลาด:0
คลิกข้อความที่ไฮไลต์ในเรียงความเพื่อดูคำแนะนำรายละเอียดเพื่อพัฒนา
การวิเคราะห์เชิงลึก
Task 1 - Academic Writing
4 tools available
บทความตัวอย่าง - IELTS Writing Task 1
ยังไม่มีบทความตัวอย่าง
กดปุ่มด้านล่างเพื่อวิเคราะห์และสร้างบทความตัวอย่างคุณภาพสูงสำหรับ Task 1