
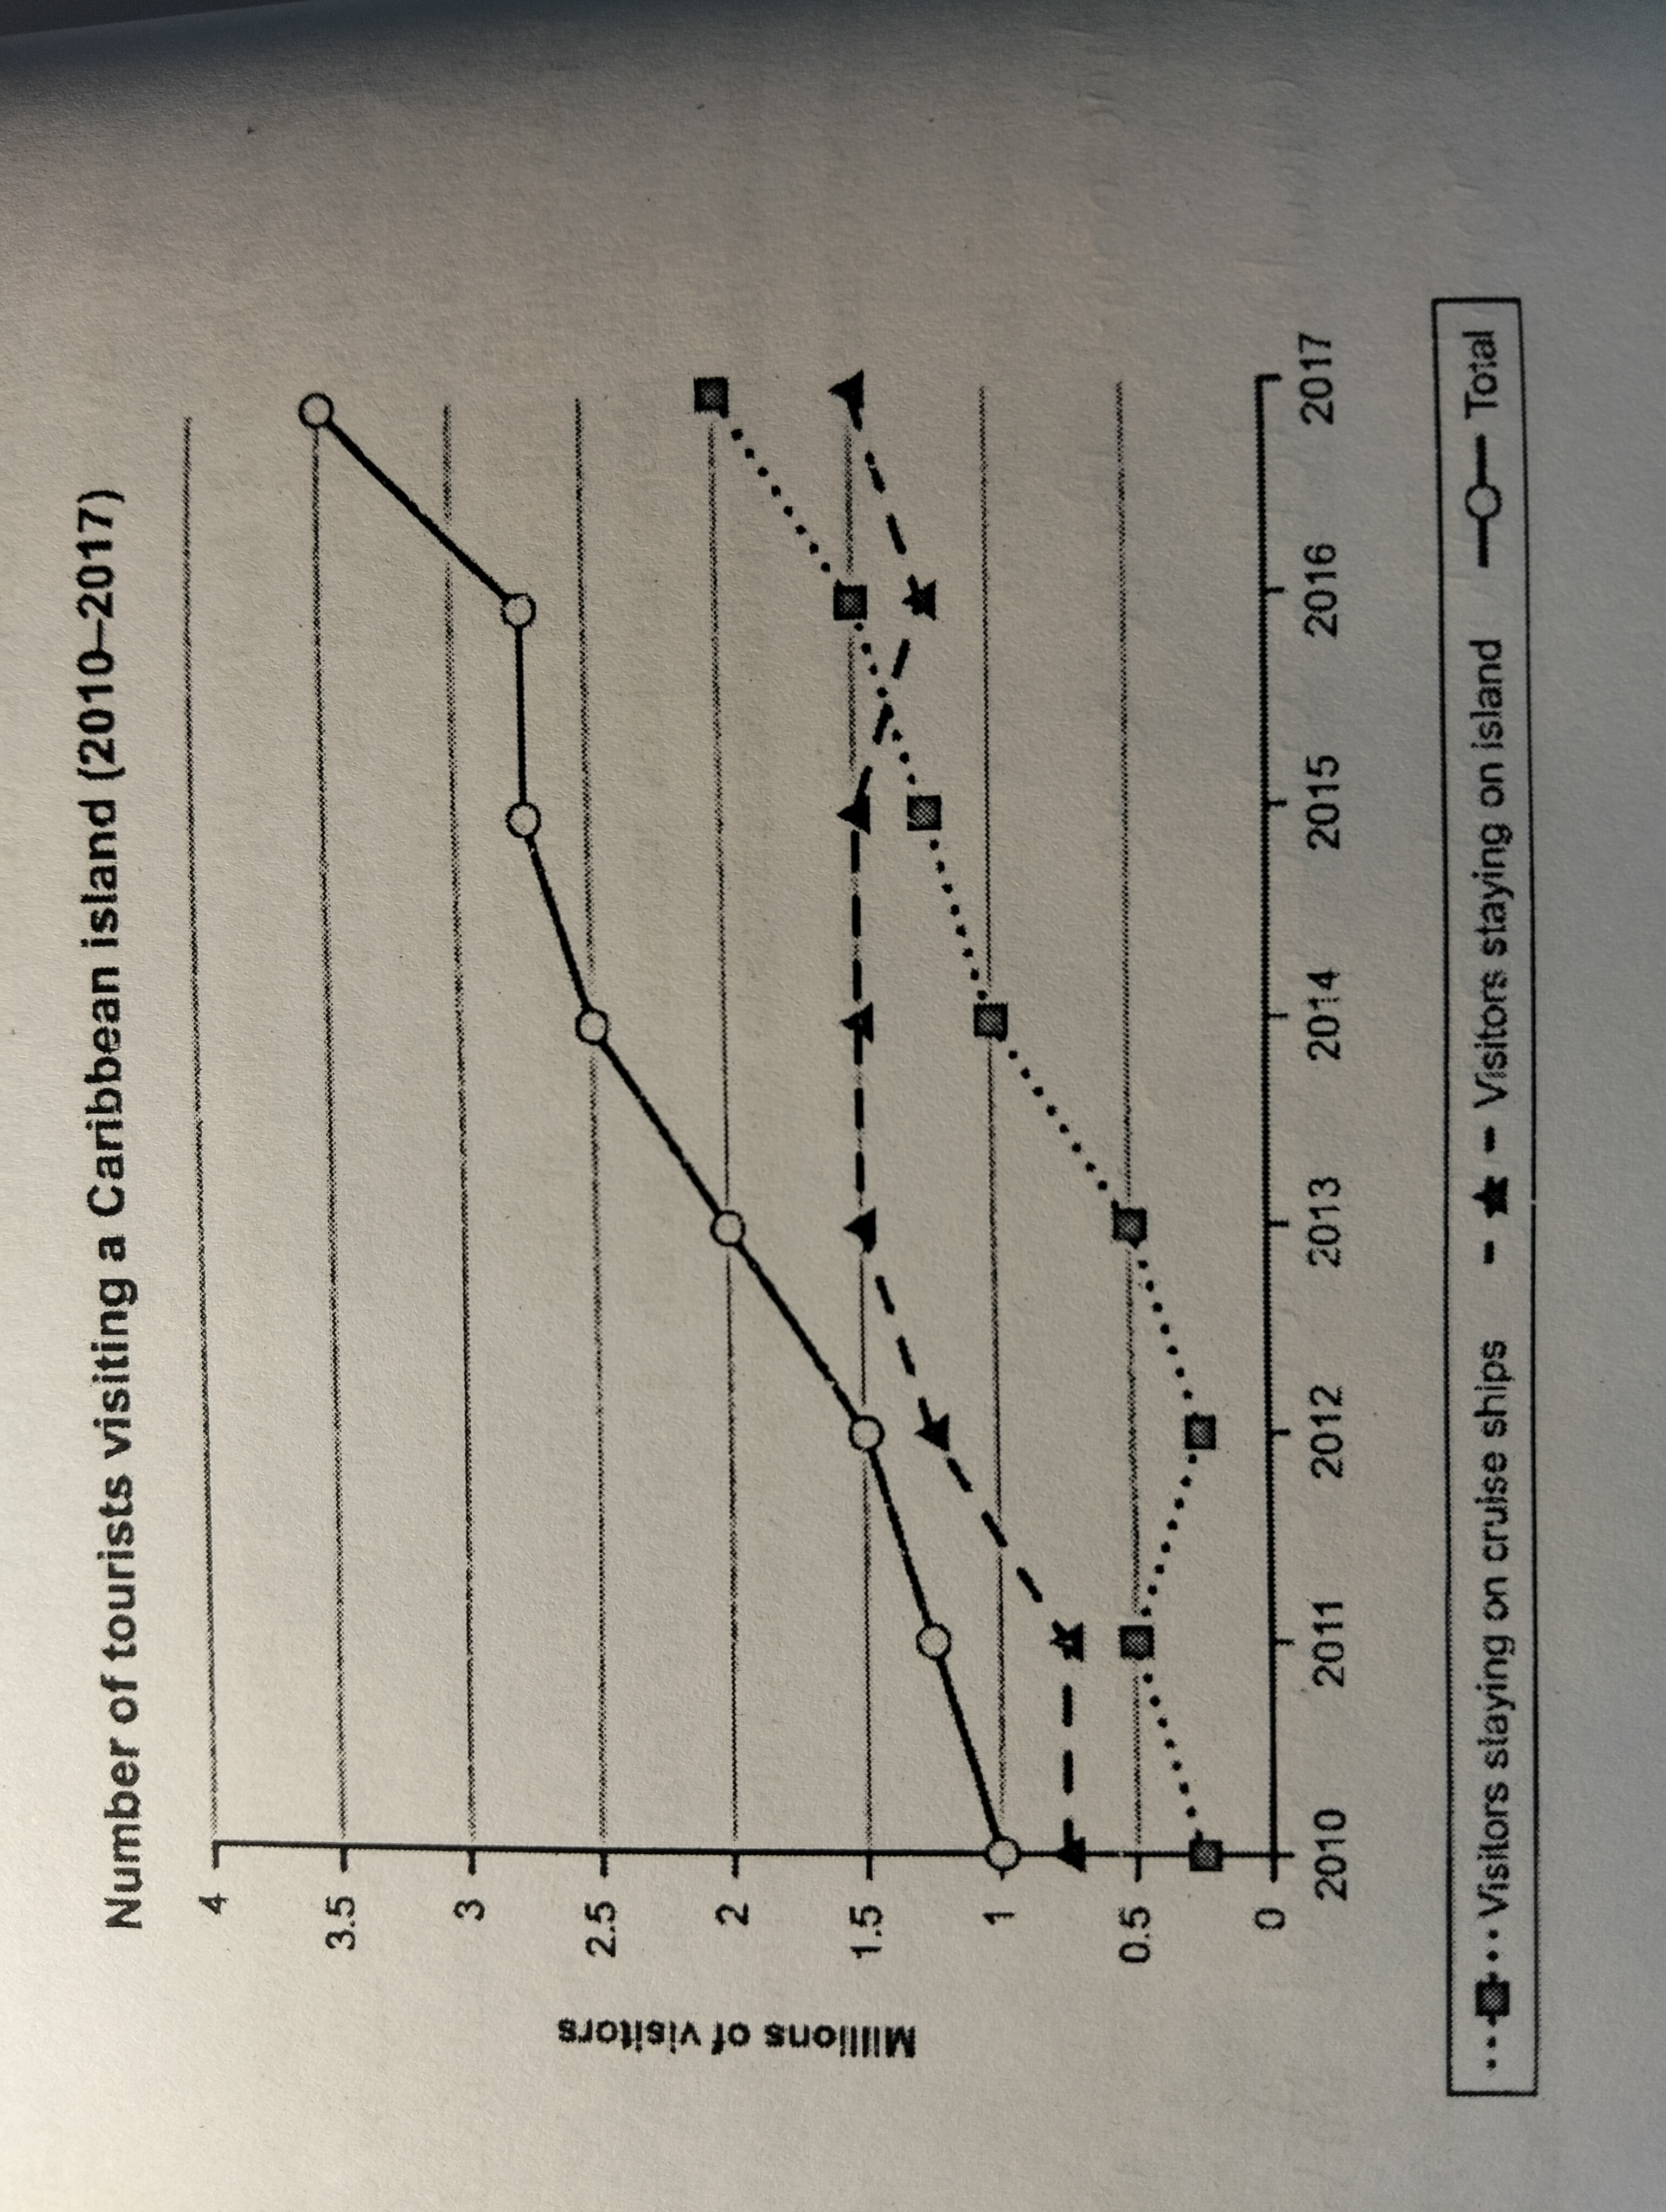
The given line chart illustrates the quantity of travellers choosing a Caribbean island for destination from 2010 to 2017. Overall, there were upward trends in both categories, leading to a significant increase in the total of visitors. Additionally, at the start, tourists preferred staying on island to staying on cruise ships, however, staying on cruise ships was more common at the end. At the beginning of the period, about 0.25 millions of visitors chosen staying on cruise ships, in comparison with nearly 0.75 millions holidaymakers staying on island. Overall the next five years, the figure for tourists witnessed a rise of roughly 2.75 millions, while staying on island remained the top reason to visit a Caribbean island. The period from 2015 to 2016 saw a slight change. The number of travellers staying on cruise ships overtaken that of visitors staying on island in 2016 and became the most popular reason to travel to a Caribbean island at the end of the period, at approximately 2 millions. Chấm điểm writing task 1 theo các thiêu chí IELTS. Chấm chặt chẽ vào
Detail Sampel
The graph below shows the number of tourists visting a particular Caribbean island between 2010 and 2017.
19/07/2026 07:15 6.0 skor
Topik
The graph below shows the number of tourists visting a particular Caribbean island between 2010 and 2017.
Jumlah kata: 180
Grafik/Diagram
Essay
Skor Keseluruhan
6.0±0.5
Cukup
Skor Kriteria Writing
TA6.0
CC7.0
LR6.0
GRA6.0
Task Achievement6.0
Target: 7.0
Kesalahan:0
Coherence & Cohesion7.0
Target: 7.0
Kesalahan:2
Lexical Resource6.0
Target: 7.0
Kesalahan:3
Grammar & Accuracy6.0
Target: 7.0
Kesalahan:0
Klik teks yang ditandai di esai untuk melihat saran detail untuk peningkatan.
Analisis mendalam
Task 1 - Academic Writing
4 tools available
Esai contoh - IELTS Writing Task 1
Belum ada esai contoh
Silakan klik tombol di bawah untuk menganalisis dan membuat esai contoh berkualitas tinggi untuk Task 1.