
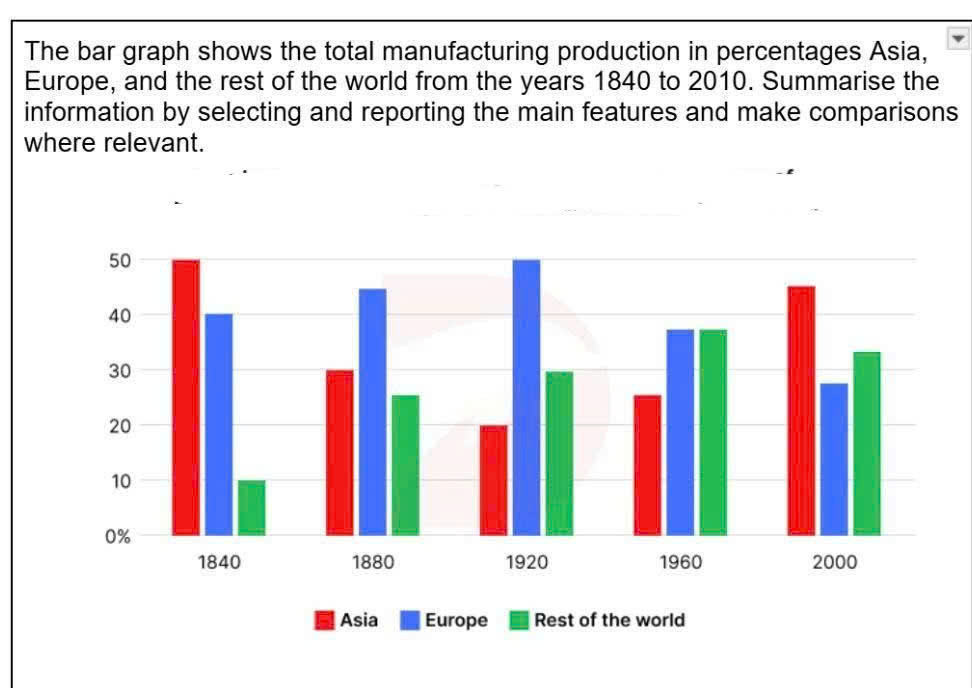
The bar chart compares the distribution of manufacturing production levels across Asia, Europe, and the other continents around the world from 1840 to 2000. Overall, the production percentages of Asia and Europe fell throughout the years, while that of the rest of the world documented a reverse pattern. Notably, despite considerable variations, the figure for Asia was still recorded as the highest by the end of the period. Regarding Asia and Europe, the first eight decades witnessed opposite trends across the two regions. Particularly, Europe dominated the manufacturing production during this period with the exception of 1840, with production output rising from 40% to 50% in 1920. Conversely, Asia saw a plummet from a peak of 50% to 20% over the same time frame. Additionally, there was a reverse trend in the remaining years. While a 25-point growth was observed in the levels of production in Asia, that of Europe declined gradually to roughly 28% by 2000. In terms of the other areas, their proportion started at a mere 10%, recording the lowest figure in the first period. Afterwards, a gradual increase was exhibited, at approximately 25% in 1880 to nearly 40% until 1960, prior to a slight decrease to around 33% by the last recorded year.
Detail Sampel
The bar graph shows the total manufacturing production in percentages Asia, Europe, and the rest of the world from the years 1840 to 2010. Summarise the information by selecting and reporting the main features and make comparisons where relevant.
19/07/2026 07:31 7.0 skor
Topik
The bar graph shows the total manufacturing production in percentages Asia, Europe, and the rest of the world from the years 1840 to 2010. Summarise the information by selecting and reporting the main features and make comparisons where relevant.
Jumlah kata: 207
Grafik/Diagram
Essay
Skor Keseluruhan
7.0±0.5
Baik
Skor Kriteria Writing
TA7.0
CC7.0
LR7.0
GRA7.0
Task Achievement7.0
Target: 7.0
Kesalahan:0
Coherence & Cohesion7.0
Target: 7.0
Kesalahan:2
Lexical Resource7.0
Target: 7.0
Kesalahan:2
Grammar & Accuracy7.0
Target: 7.0
Kesalahan:0
Klik teks yang ditandai di esai untuk melihat saran detail untuk peningkatan.
Analisis mendalam
Task 1 - Academic Writing
4 tools available
Esai contoh - IELTS Writing Task 1
Belum ada esai contoh
Silakan klik tombol di bawah untuk menganalisis dan membuat esai contoh berkualitas tinggi untuk Task 1.