
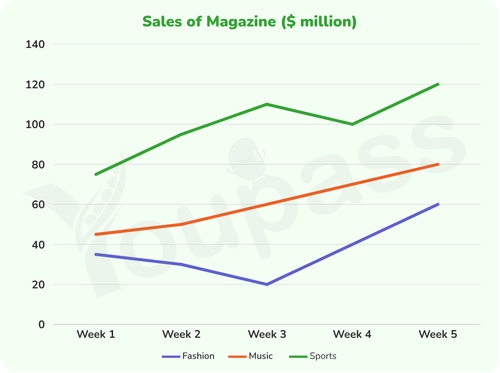
The given chart illustrates sales of three catagories of magazines, there are fashion, music and sports in a region over five weeks. Overall, the amounts of sales of sports and music magazines surged significantly, while fashion increased steadily. Additionly, sports magazines reached a peak in week 5, wheares fashion hit the bottom in week 3. The figure for sales of sports magazines stood at around 75$ million in week 1, before soared sharply to about 110$ million in week 3. After that, this category decreased slightly to 100$ million in week 4 then recovering to 120$ million in week 5. Moreover, there was a rapid rise from 40$ million to 80$ million in music during 5 weeks. The amount of fashion sales started at around 35$ million in week 1 which was followed by a significant fall to 20$ million in week 3. Then, it rose triple to 60$ million in week 5.
Sample Detail
The chart below shows sales of three categories of magazines (fashion, music, and sports) in a particular region over five weeks. Summarise the information by selecting and reporting the main features, and make comparisons where relevant.
19/07/2026 07:57 6.0 points
Topic
The chart below shows sales of three categories of magazines (fashion, music, and sports) in a particular region over five weeks. Summarise the information by selecting and reporting the main features, and make comparisons where relevant.
Word count: 153
Chart/Graph
Essay
Overall Scores
6.0±0.5
Fair
Writing Criteria Scores
TA6.0
CC6.0
LR6.0
GRA6.0
Task Achievement6.0
Target: 7.0
Errors:1
Coherence & Cohesion6.0
Target: 7.0
Errors:2
Lexical Resource6.0
Target: 7.0
Errors:3
Grammar & Accuracy6.0
Target: 7.0
Errors:0
Click on any highlighted text in the essay to view detailed suggestions for improvement.
Deep Analysis
Task 1 - Academic Writing
4 tools available
Sample Essay - IELTS Writing Task 1
No sample essay
Click the button below to analyze and generate a high-quality sample essay for Task 1.