
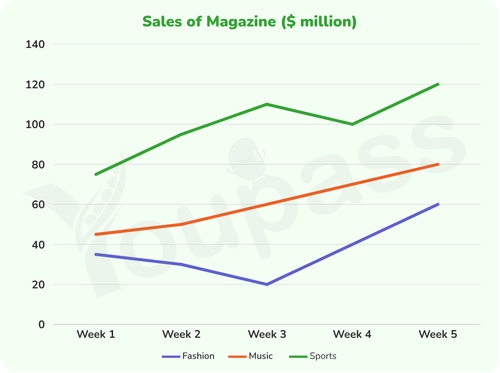
The given chart illustrates sales of three catagories of magazines, there are fashion, music and sports in a region over five weeks. Overall, the amounts of sales of sports and music magazines surged significantly, while fashion increased steadily. Additionly, sports magazines reached a peak in week 5, wheares fashion hit the bottom in week 3. The figure for sales of sports magazines stood at around 75$ million in week 1, before soared sharply to about 110$ million in week 3. After that, this category decreased slightly to 100$ million in week 4 then recovering to 120$ million in week 5. Moreover, there was a rapid rise from 40$ million to 80$ million in music during 5 weeks. The amount of fashion sales started at around 35$ million in week 1 which was followed by a significant fall to 20$ million in week 3. Then, it rose triple to 60$ million in week 5.
รายละเอียดตัวอย่าง
The chart below shows sales of three categories of magazines (fashion, music, and sports) in a particular region over five weeks. Summarise the information by selecting and reporting the main features, and make comparisons where relevant.
19/07/2026 07:57 6.0 คะแนน
หัวข้อ
The chart below shows sales of three categories of magazines (fashion, music, and sports) in a particular region over five weeks. Summarise the information by selecting and reporting the main features, and make comparisons where relevant.
จำนวนคำ: 153
แผนภูมิ/กราฟ
Essay
คะแนนรวม
6.0±0.5
ดีพอใช้
คะแนนเกณฑ์การเขียน
TA6.0
CC6.0
LR6.0
GRA6.0
Task Achievement6.0
เป้าหมาย: 7.0
ข้อผิดพลาด:1
Coherence & Cohesion6.0
เป้าหมาย: 7.0
ข้อผิดพลาด:2
Lexical Resource6.0
เป้าหมาย: 7.0
ข้อผิดพลาด:3
Grammar & Accuracy6.0
เป้าหมาย: 7.0
ข้อผิดพลาด:0
คลิกข้อความที่ไฮไลต์ในเรียงความเพื่อดูคำแนะนำรายละเอียดเพื่อพัฒนา
การวิเคราะห์เชิงลึก
Task 1 - Academic Writing
4 tools available
บทความตัวอย่าง - IELTS Writing Task 1
ยังไม่มีบทความตัวอย่าง
กดปุ่มด้านล่างเพื่อวิเคราะห์และสร้างบทความตัวอย่างคุณภาพสูงสำหรับ Task 1