
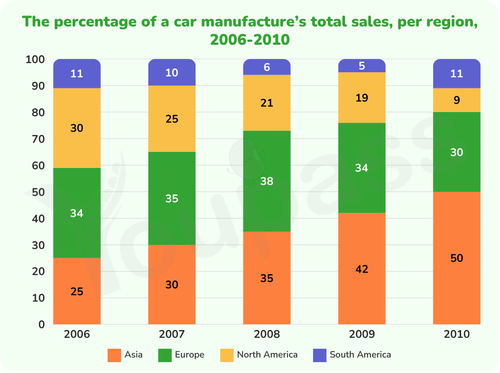
The chart illustrates the proportion of a car producer's total sales in 5 different regions ( Asia, Europe, North America, South America ) between 2006 and 2010. Overall, there were downward trends in total sales of Europe and North America, while Asia followed an upward trend and South America experienced stability. Moreover, Asia dominated the chart in final years, whereas South America consistently stayed the least throughout the period. Looking at two nations with the most noticeable trends, Europe started at the highest point, approximately 34%, while Asia was lower with the figure of 25%. The percentage of sales in Europe saw a slight increase to 38% in 2008, before dropping to 30% at the end of the period. Meanwhile, Asia's share of total sales rose steadily to 35% in 2008, then this figure continued growing and surpassing Europe during the final years to reach the highest level, roughly 50% in 2010. Regarding the two remaining regions, the total sales of South America was the smallest, at 11% in 2006, while that of North America was higher, nearly 30%. The proprotion of sales in South America experienced a dramatic decline to 5% in 2009, but later increased rapidly to return to its original level in 2010. By contrast, the proportion of sales in North America plummeted to hit the lowest point, at around 9% at the end of the period.
Sample Detail
The chart below shows the percentage of a car manufacturer’s total sales in various regions from 2006 to 2010. Summarise the information by selecting and reporting the main features, and make comparisons where relevant.
19/07/2026 08:04 7.0 points
Topic
The chart below shows the percentage of a car manufacturer’s total sales in various regions from 2006 to 2010. Summarise the information by selecting and reporting the main features, and make comparisons where relevant.
Word count: 230
Chart/Graph
Essay
Overall Scores
7.0±0.5
Good
Writing Criteria Scores
TA7.0
CC7.0
LR7.0
GRA7.0
Task Achievement7.0
Target: 7.0
Errors:0
Coherence & Cohesion7.0
Target: 7.0
Errors:2
Lexical Resource7.0
Target: 7.0
Errors:3
Grammar & Accuracy7.0
Target: 7.0
Errors:0
Click on any highlighted text in the essay to view detailed suggestions for improvement.
Deep Analysis
Task 1 - Academic Writing
4 tools available
Sample Essay - IELTS Writing Task 1
No sample essay
Click the button below to analyze and generate a high-quality sample essay for Task 1.