
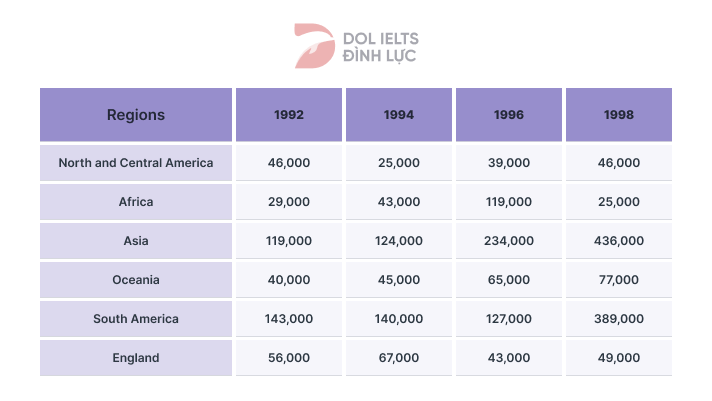
The chart illustrates how many tonnes of cacao beans were manufactured in six distinct parts of the world over a period of 6 years. It is obvious from the chart that there was an upward trend in the cacao production in Asia, Oceania and South America. However, the reverse pattern was true for both Africa and England. In 1992, South America’s cacao production was the highest, reaching 143000 tonnes. Meanwhile, the figures for North & Central America and Oceania were much lower, with only 46000 and 40000 tonnes, in term with Asia’s figure just 119000 tonnes. After six years, the number of cacao beans manufactured in Asia enormously climbed and reached a peak of 234000 tonnes, compared to 389000 tonnes of South America and 77000 tonnes belonged to Oceania . Meanwhile, North and Central America stayed unchanged during the period. Turning to the remaining nations we can see that in 1992, around 56000 tonnes cacao beans were producted in England, whilst Africa was by far lower, only 29000 tonnes. In the following three years, the quantity of cacao beans made in both Africa and England steadily dropped, to 25000 tonnes and 49000 tonnes in turn.
নমুনা বিস্তারিত
The table below shows the production of cacao beans in six regions between 1992 and 1998
19/07/2026 08:26 5.5 স্কোর
টপিক বা বিষয়
The table below shows the production of cacao beans in six regions between 1992 and 1998
শব্দ সংখ্যা: 195
চার্ট/গ্রাফ
Essay
সামগ্রিক স্কোর
5.5±0.5
প্রাথমিক
রাইটিং মানদণ্ড স্কোর
TA5.0
CC6.0
LR5.0
GRA6.0
Task Achievement5.0
লক্ষ্যমাত্রা: 7.0
ভুল:1
Coherence & Cohesion6.0
লক্ষ্যমাত্রা: 7.0
ভুল:2
Lexical Resource5.0
লক্ষ্যমাত্রা: 7.0
ভুল:4
Grammar & Accuracy6.0
লক্ষ্যমাত্রা: 7.0
ভুল:0
উন্নতির জন্য বিস্তারিত পরামর্শ দেখতে প্রবন্ধের হাইলাইট করা যেকোনো লেখায় ক্লিক করুন।
গভীর বিশ্লেষণ
Task 1 - Academic Writing
4 tools available
নমুনা রচনা - IELTS Writing Task 1
কোনো নমুনা রচনা নেই
টাস্ক ১-এর জন্য উচ্চমানের নমুনা রচনা বিশ্লেষণ এবং তৈরি করতে নিচের বাটনে ক্লিক করুন।