
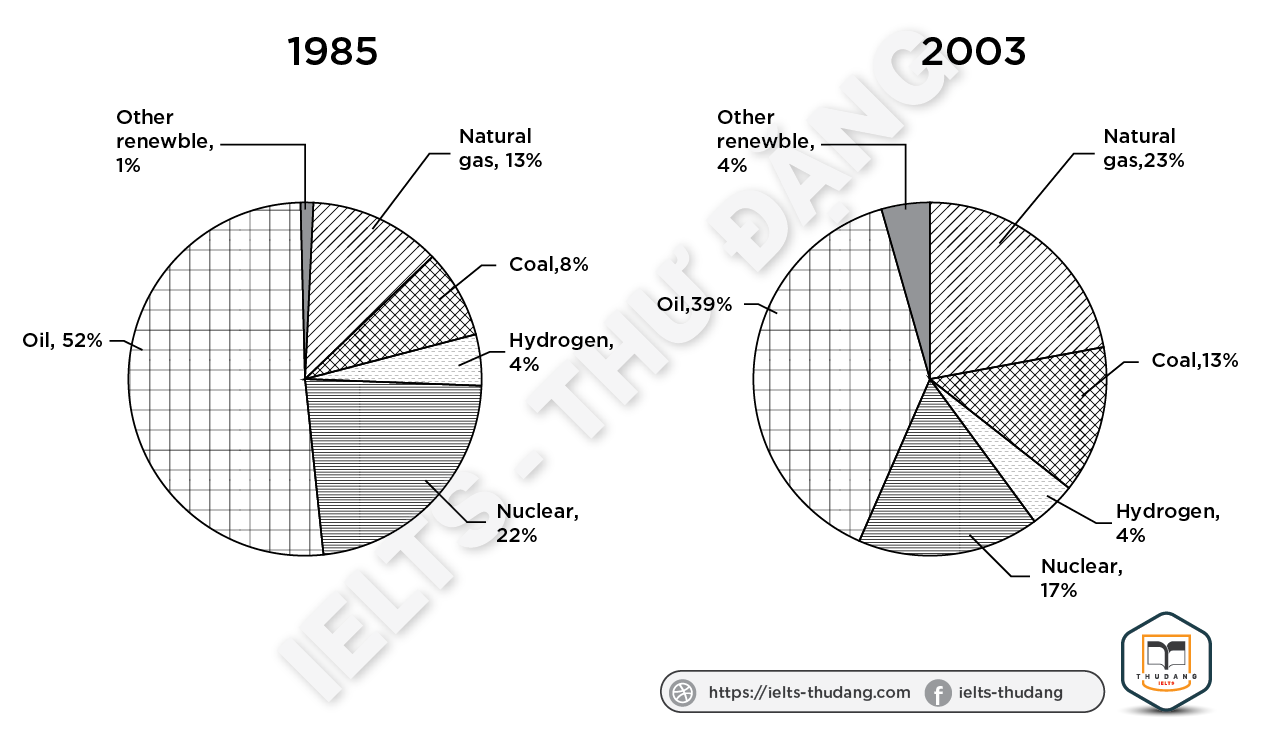
The pie chart illustrate the percentage of energy generated from six distinct sources- oil, natural oil, nuclear power, coal, other renewable, and hydrogen- in a specific nation in two different years 1985 and 2003. Overall, it is clear that oil remained the primary source of energy production in both years, despite experiencing a notable decline. In contrast, the reliance on natural gas, coal, renewable energy and hydrogen witnessed upward trends, while nuclear power saw a minor drop in its share. Looking first at the dominant energy sources, oil accounted for more than half of the total energy production in 1985, at 52%. However, by 2003, this figure had significantly dropped to 39%, through it still held the largest contributor in 1985 at 22%, also experienced a slight decrease, falling to 19% by the end of the period. Conversely, the proportions of energy generated from alternative sources expanded. The most substantial growth was seen in natural gas, whose share nearly doubled from 13% in 1985 to 23% in 2003, surpassing nuclear power to become the second most important source. Similarly, the percentage of energy produced from coal rose moderately from 8% to 13%. Meanwhile, other renewable energy sources, despite remaining the least utilized, quadrupled from a negligible 1% to 4% over the 18-year period.
নমুনা বিস্তারিত
The charts below show the proportion of the energy produced from different sources in a country between 1985 and 2003. Summarize the information by selecting and reporting the main features and make comparisons where relevant.
19/07/2026 08:36 6.5 স্কোর
টপিক বা বিষয়
The charts below show the proportion of the energy produced from different sources in a country between 1985 and 2003. Summarize the information by selecting and reporting the main features and make comparisons where relevant.
শব্দ সংখ্যা: 213
চার্ট/গ্রাফ
Essay
সামগ্রিক স্কোর
6.5±0.5
মোটামুটি
রাইটিং মানদণ্ড স্কোর
TA6.0
CC7.0
LR7.0
GRA7.0
Task Achievement6.0
লক্ষ্যমাত্রা: 7.0
ভুল:0
Coherence & Cohesion7.0
লক্ষ্যমাত্রা: 7.0
ভুল:1
Lexical Resource7.0
লক্ষ্যমাত্রা: 7.0
ভুল:3
Grammar & Accuracy7.0
লক্ষ্যমাত্রা: 7.0
ভুল:0
উন্নতির জন্য বিস্তারিত পরামর্শ দেখতে প্রবন্ধের হাইলাইট করা যেকোনো লেখায় ক্লিক করুন।
গভীর বিশ্লেষণ
Task 1 - Academic Writing
4 tools available
নমুনা রচনা - IELTS Writing Task 1
কোনো নমুনা রচনা নেই
টাস্ক ১-এর জন্য উচ্চমানের নমুনা রচনা বিশ্লেষণ এবং তৈরি করতে নিচের বাটনে ক্লিক করুন।