
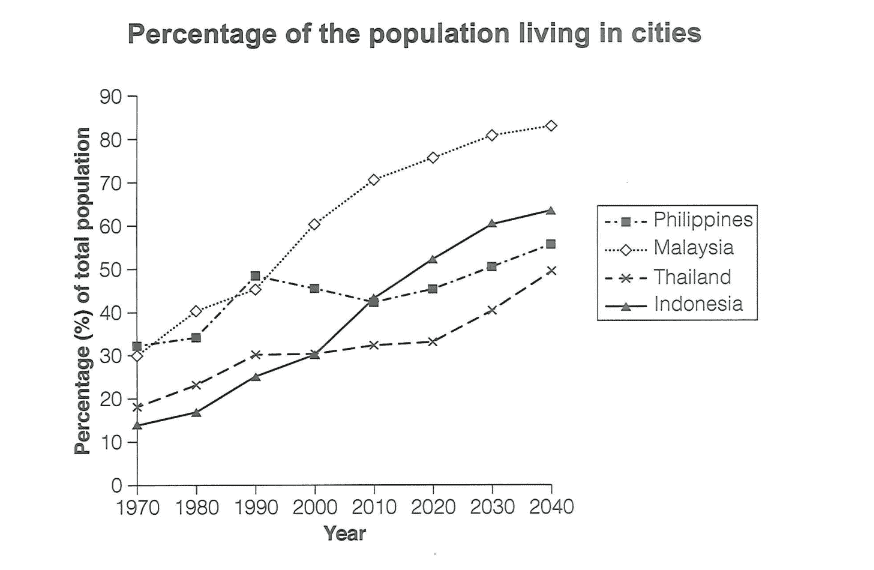
The line graph illustrates the percentage of the population living in urban areas across four Asian countries from 1970 to 2020, with predictions for the following 20 years. Overall, while all four countries experienced an upward trend, the most noticeable trend was for Malaysia, which witnessed the most dramatic growth throughout the period and the prediction period. Initially, the urbanization rate in the Philippines was recorded at the highest percentage in 1970, at 31%. This was followed by Malaysia, with just 1% lower. The remaining two countries this year were Thailand at 18% and Indonesia at just under 15%. Next, all the figures increased until the proportion of city dwellers living in Thailand and Malaysia converged at 28% in 2000. A similar intersection occurred between Indonesia and the Philippines in 2010, at 42%. Looking ahead to the year 2040, all four countries are projected to maintain their upward trend, with the highest percentage being reached by Malaysia at 91% in the end. This will be followed by Indonesia, the Philippines, and Thailand, which will account for 63%, 56%, and 48%, respectively.
Detail Sampel
The graph below gives information about the percentage of the population in four Asian countries living in cities from 1970 to 2020, with predictions for 2030 and 2040.
19/07/2026 09:23 6.5 skor
Topik
The graph below gives information about the percentage of the population in four Asian countries living in cities from 1970 to 2020, with predictions for 2030 and 2040.
Jumlah kata: 181
Grafik/Diagram
Essay
Skor Keseluruhan
6.5±0.5
Cukup
Skor Kriteria Writing
TA6.0
CC7.0
LR7.0
GRA7.0
Task Achievement6.0
Target: 7.0
Kesalahan:0
Coherence & Cohesion7.0
Target: 7.0
Kesalahan:3
Lexical Resource7.0
Target: 7.0
Kesalahan:2
Grammar & Accuracy7.0
Target: 7.0
Kesalahan:0
Klik teks yang ditandai di esai untuk melihat saran detail untuk peningkatan.
Analisis mendalam
Task 1 - Academic Writing
4 tools available
Esai contoh - IELTS Writing Task 1
Belum ada esai contoh
Silakan klik tombol di bawah untuk menganalisis dan membuat esai contoh berkualitas tinggi untuk Task 1.