
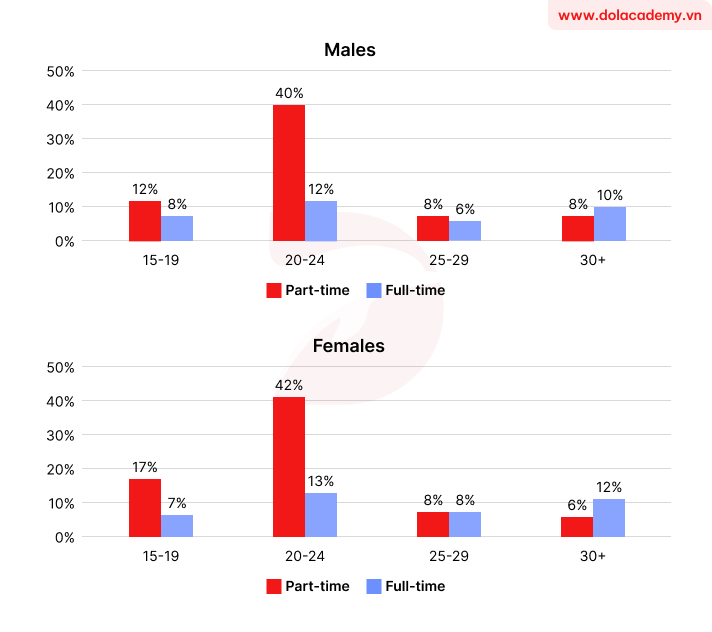
The bar charts illustrate the proportion of male and female students studying in Australia for full-time and part-time education in 2006 , categorized by four age groups . Overall, the percentage of full-time workers were lower than those part-time in most genders . Part-time aged from 20-24 had the highest figure , while the peak for full-time was recorded at the oldest age group for both genders . Regarding the men , for the 15-19 age group , 12% for part-time education participated in Australia , whereas the figure for full-time was lower , at 8% . The biggest gap was recorded among the 20-24 age group , with part-time climbing from 12% to 40% and women increasing to 12% . For example , the percentage of part-time and full-time workers from their md-twentie to 19 was 8% and 6% , respectively . Meanwhile , the age group 30+ witnessed a slightly pattern , this only exception as fewer part-time did educate compared to full-time in the other three age groups Following with the women , the figure for part-time education stood at 17% and 7% in the 15-19 age group . The largest change was recorded at the 20-24 age group with 42% for part-time whereas the figure for full-time was lower at 18% . The 25-29 age group experienced the same pattern was remained at 8% . The proportion of female over 30 years in full-time was stood at 12% and increased double with the part-time
नमूना विवरण
The charts below show the percentage of male and female students of different age groups who studied in Australia for full-time and part-time education in 2006. Summarize the information by describing the main features of the charts and making comparisons where appropriate
19/07/2026 09:28 5.0 अंक
विषय
The charts below show the percentage of male and female students of different age groups who studied in Australia for full-time and part-time education in 2006. Summarize the information by describing the main features of the charts and making comparisons where appropriate
शब्दों की संख्या: 248
चार्ट/ग्राफ
Essay
समग्र स्कोर
5.0±0.5
बुनियादी
राइटिंग मानदंड स्कोर
TA5.0
CC5.0
LR5.0
GRA5.0
Task Achievement5.0
लक्ष्य: 7.0
त्रुटियां:0
Coherence & Cohesion5.0
लक्ष्य: 7.0
त्रुटियां:4
Lexical Resource5.0
लक्ष्य: 7.0
त्रुटियां:3
Grammar & Accuracy5.0
लक्ष्य: 7.0
त्रुटियां:0
सुधार के विस्तृत सुझाव देखने के लिए लेख में किसी भी हाइलाइट किए गए टेक्स्ट पर क्लिक करें।
गहन विश्लेषण
Task 1 - Academic Writing
4 उपकरण उपलब्ध
नमूना लेख - IELTS Writing Task 1
कोई नमूना लेख नहीं
Task 1 के लिए उच्च-गुणवत्ता वाला नमूना लेख विश्लेषण और बनाने के लिए नीचे दिए गए बटन पर क्लिक करें।