
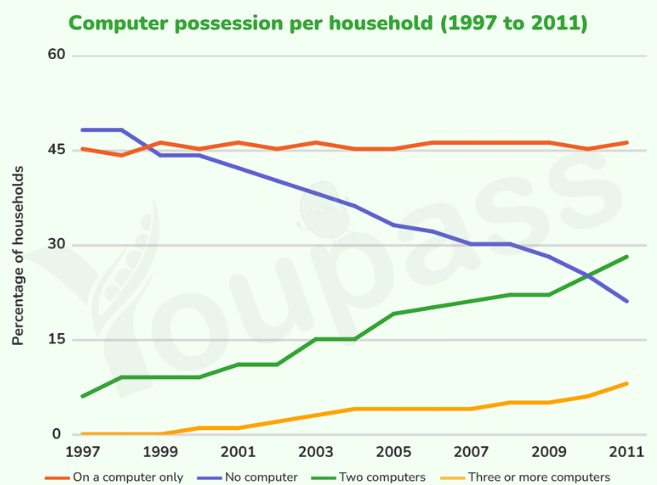
The provided line chart illustrates the proportions of households, categorized by the number of computers per house in a specific European country from 1997 to 2011. Overall, the percentage of those without any computers fell significantly, while the figure for more than one computer increased gradually throughout the period. Meanwhile, households that have only one were the most common group during nearly the entire time. Turning to households with 2 or more computers, there was a beginning at roughly 7% and 0% in the data of two and three or more computers, respectively. After that, the rate of families owning two computers rose steadily, to 15% in 2003 and approximately 20% in 2007, before ending at around 30%. A similar trend was recorded in the house with over three computers, which happened more slowly. It started increasing in 2000 and reached its peak at about 8% by 2011. In 1997, computer-free households constituted the largest category at just under 50%, followed by those that had a single device at exactly 45%. Then, there was a dramatic decline in houses without any machines, to 30% in 2007, before a witness in a region of one-fifth of all sectors by 2011. Conversely, the figure for those possessing one computer remained stable between 44% and 46% by the end of the timeframe.
Detail Sampel
The graph below gives information about computer possession by household in one European country between 1997 and 2011. Summarise the information by selecting and reporting the main features, and make comparisons where relevant.
19/07/2026 09:41 7.0 skor
Topik
The graph below gives information about computer possession by household in one European country between 1997 and 2011. Summarise the information by selecting and reporting the main features, and make comparisons where relevant.
Jumlah kata: 219
Grafik/Diagram
Essay
Skor Keseluruhan
7.0±0.5
Baik
Skor Kriteria Writing
TA7.0
CC7.0
LR7.0
GRA7.0
Task Achievement7.0
Target: 7.0
Kesalahan:0
Coherence & Cohesion7.0
Target: 7.0
Kesalahan:1
Lexical Resource7.0
Target: 7.0
Kesalahan:3
Grammar & Accuracy7.0
Target: 7.0
Kesalahan:0
Klik teks yang ditandai di esai untuk melihat saran detail untuk peningkatan.
Analisis mendalam
Task 1 - Academic Writing
4 tools available
Esai contoh - IELTS Writing Task 1
Belum ada esai contoh
Silakan klik tombol di bawah untuk menganalisis dan membuat esai contoh berkualitas tinggi untuk Task 1.