
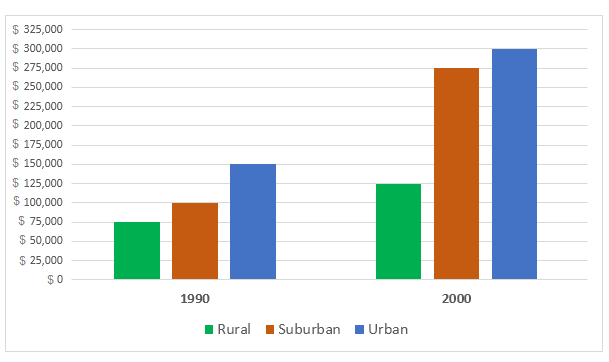
The bar graph compares the housing costs in two different years in rural, suburban and city areas. As an overall trend, the housing price increased considerably in 2000 than that of 1990 and housing in city areas were far more expensive than it was in villages and towns. As can be seen in the column graph, the cost of accommodation in village area was 75 thousand dollars in 1990 and it was 25 thousand more in the suburban area. Housing cost in city areas was the highest and it was precisely double than the price of houses in rural areas. After a decade the housing cost increased remarkably and in city areas, it went as high as 300 thousand dollars, which was exactly double than that of 1990’s housing price. The housing cost in suburban areas skyrocketed and reached to 275 thousand which was almost 3 times higher than that of 10 years ago. Finally, the housing cost in rural areas also went up in the ten years’ time but was far cheaper than that of city areas.
รายละเอียดตัวอย่าง
The graph below shows the average cost of housing in three different areas. Summarise the information by selecting and reporting the main features, and make comparisons where relevant.
19/07/2026 10:03 7.0 คะแนน
หัวข้อ
The graph below shows the average cost of housing in three different areas. Summarise the information by selecting and reporting the main features, and make comparisons where relevant.
จำนวนคำ: 178
แผนภูมิ/กราฟ
Essay
คะแนนรวม
7.0±0.5
ดีมาก
คะแนนเกณฑ์การเขียน
TA7.0
CC7.0
LR7.0
GRA7.0
Task Achievement7.0
เป้าหมาย: 7.0
ข้อผิดพลาด:0
Coherence & Cohesion7.0
เป้าหมาย: 7.0
ข้อผิดพลาด:3
Lexical Resource7.0
เป้าหมาย: 7.0
ข้อผิดพลาด:3
Grammar & Accuracy7.0
เป้าหมาย: 7.0
ข้อผิดพลาด:0
คลิกข้อความที่ไฮไลต์ในเรียงความเพื่อดูคำแนะนำรายละเอียดเพื่อพัฒนา
การวิเคราะห์เชิงลึก
Task 1 - Academic Writing
4 tools available
บทความตัวอย่าง - IELTS Writing Task 1
ยังไม่มีบทความตัวอย่าง
กดปุ่มด้านล่างเพื่อวิเคราะห์และสร้างบทความตัวอย่างคุณภาพสูงสำหรับ Task 1