
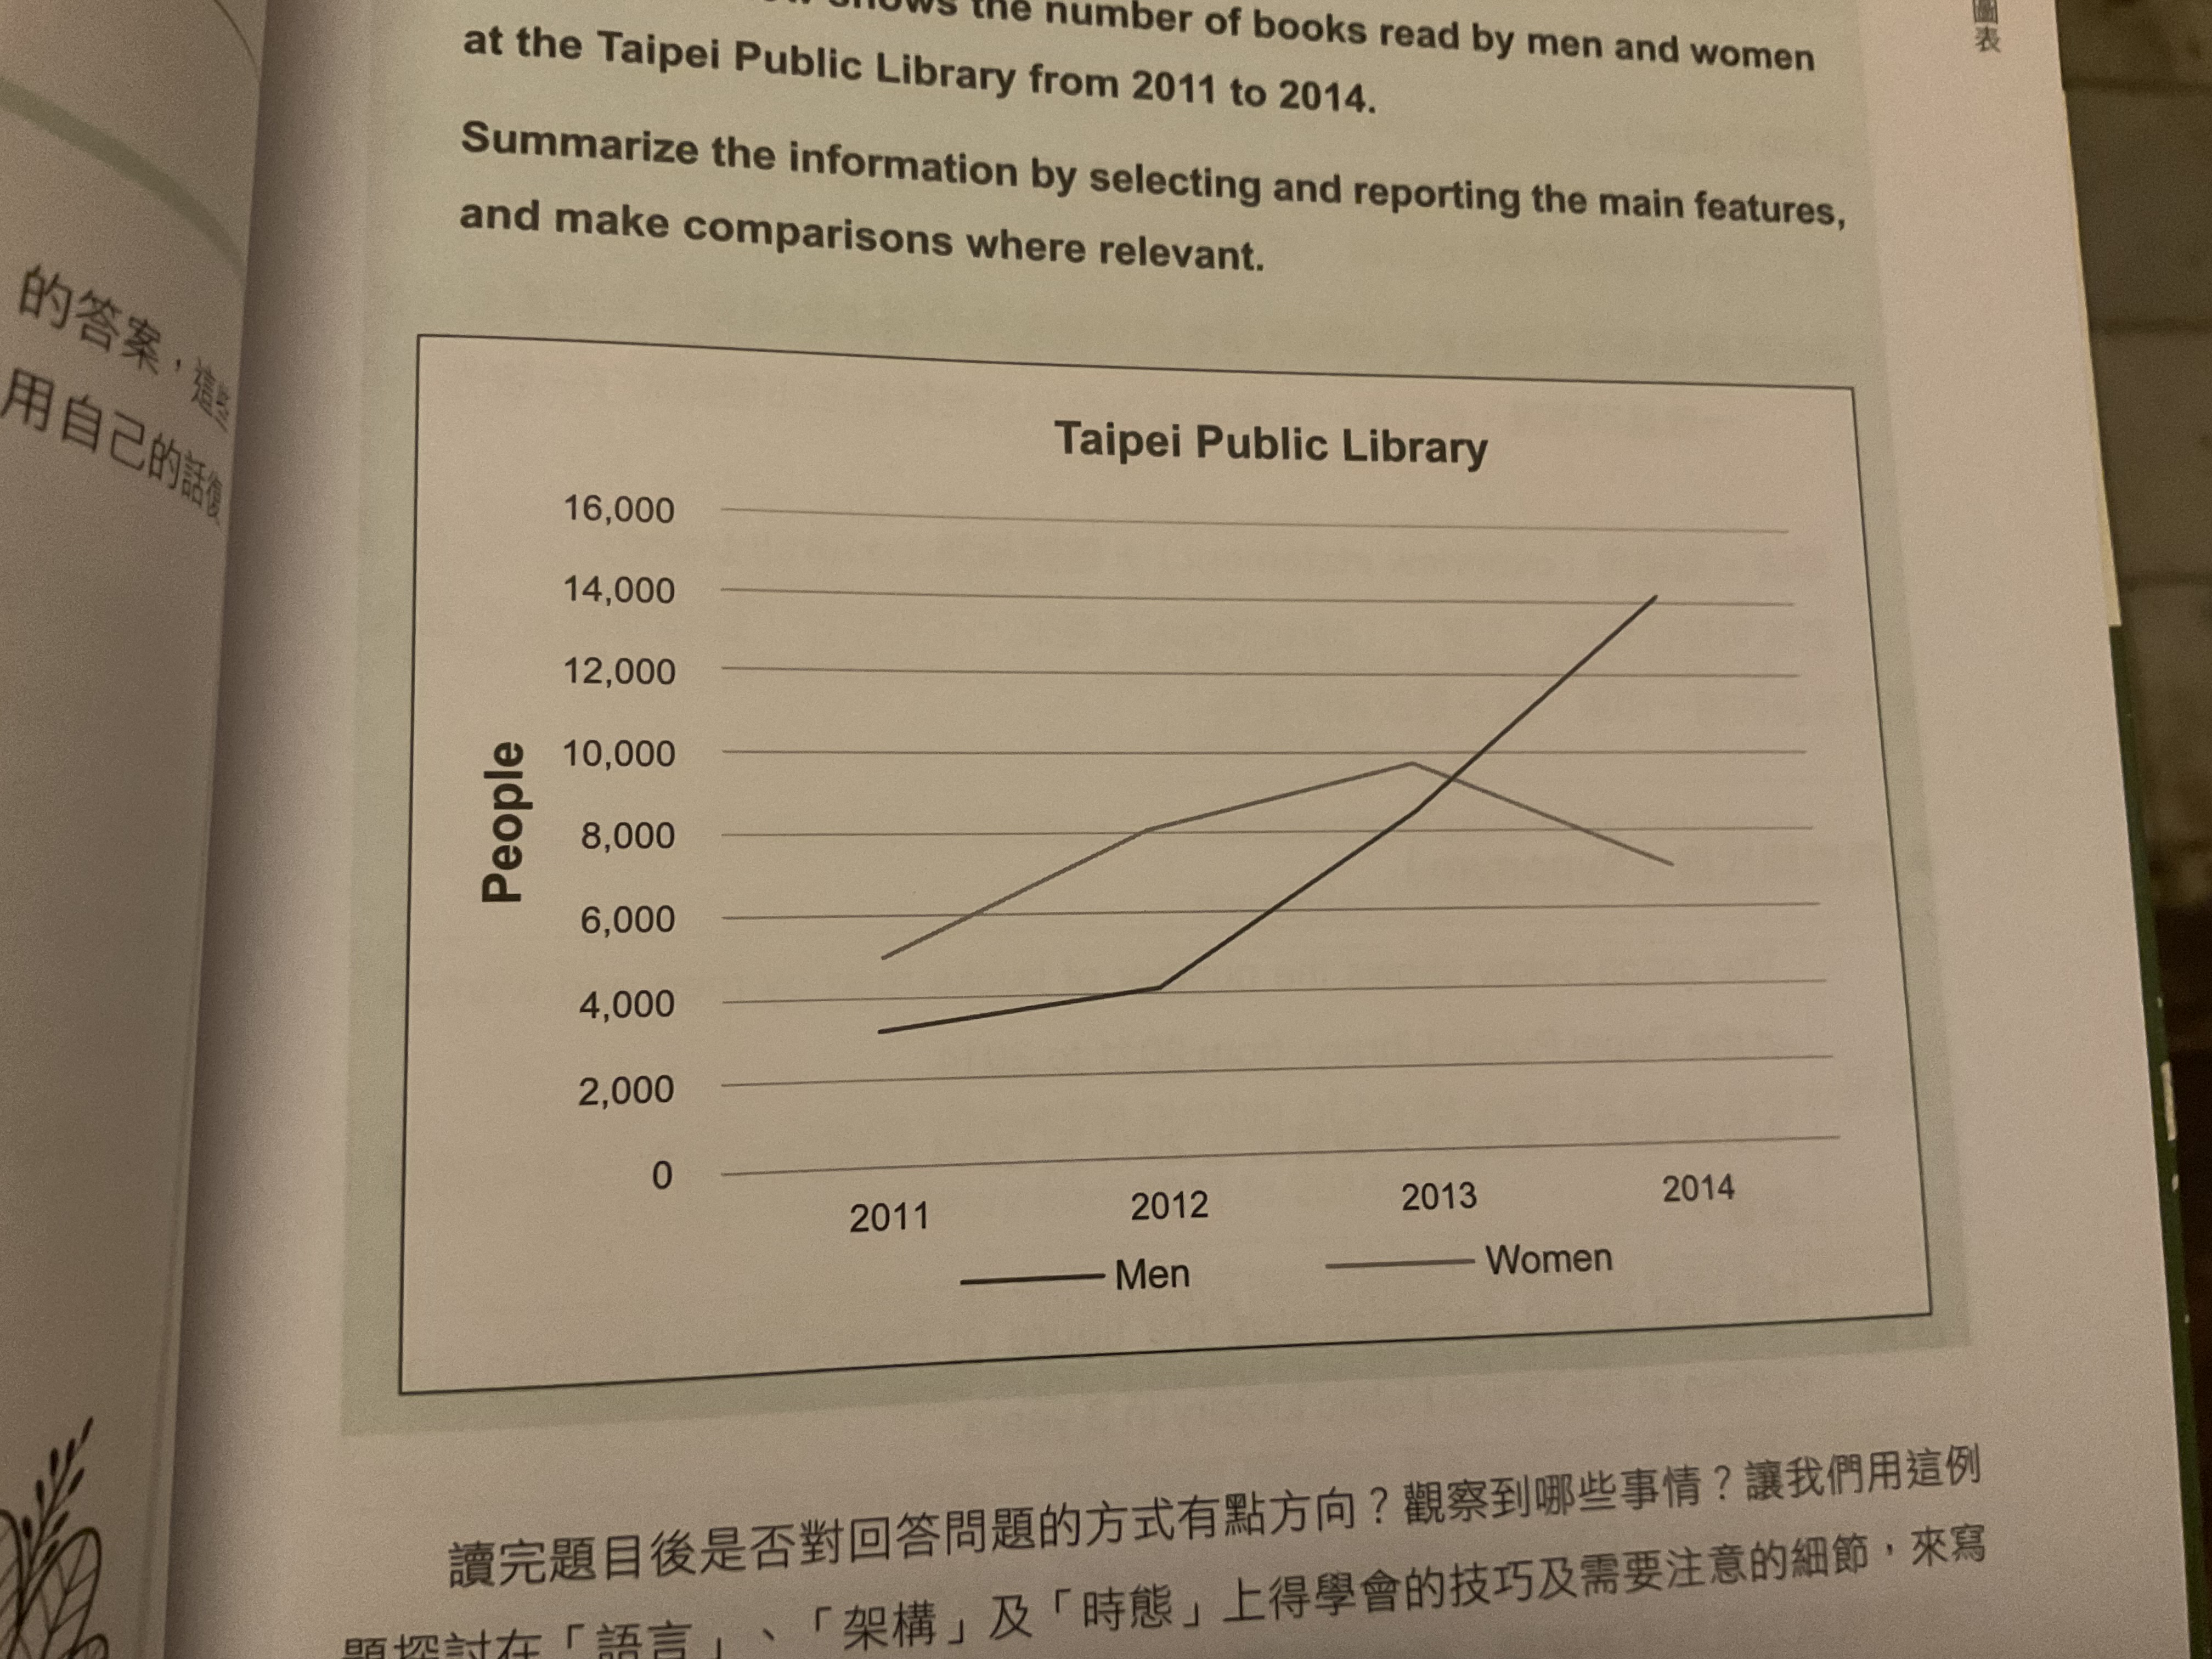
The line graph illustrated the number of books that read by men and women at Taipei Public Library in 2011 to 2014. In general, the graph shows that the number of books read by both gender had climbed in these 3 years, expect in 2014 where women's figure dropped down. Furthermore, women’s figure are generally higher than men’s, besides the year of 2014 where the women’s figure dropped, while men’s increase. This Resulted in men’s figure surpassing women’s the first time. In 2011, men read approximately 3,000 books, and the number steadily rose to 4000 in 2012. Then it followed by a dramatic surge over the next two years, with the figure rising to 9000 in 2013 and reaching at 14000 in 2014. Women, in contrast, displayed a gradual increase from 5,000 in 2011 to 9000 in 2013. However, the upward trend reversed in 2014, with the number decline to roughly 7000 books.
Sample Detail
The graph shows the number of books read by men and women at the Taipei Public Library from 2011 to 2013.
19/07/2026 10:15 5.5 points
Topic
The graph shows the number of books read by men and women at the Taipei Public Library from 2011 to 2013.
Word count: 153
Chart/Graph
Essay
Overall Scores
5.5±0.5
Basic
Writing Criteria Scores
TA5.0
CC6.0
LR5.0
GRA6.0
Task Achievement5.0
Target: 7.0
Errors:0
Coherence & Cohesion6.0
Target: 7.0
Errors:3
Lexical Resource5.0
Target: 7.0
Errors:4
Grammar & Accuracy6.0
Target: 7.0
Errors:0
Click on any highlighted text in the essay to view detailed suggestions for improvement.
Deep Analysis
Task 1 - Academic Writing
4 tools available
Sample Essay - IELTS Writing Task 1
No sample essay
Click the button below to analyze and generate a high-quality sample essay for Task 1.