
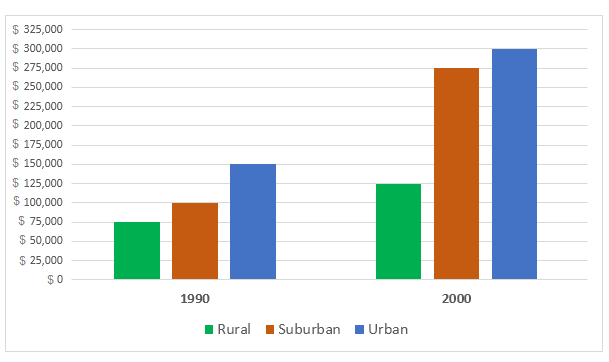
The graph compares the average housing costs in rural, suburban and urban area in 1990 and 2000. Looking at the graph in more detail, housing costs in all three areas rose significantly between 1990 and 2000. Urban areas consistently remained the most expensive cost, while rural areas were the cheapest throughout the period. In 1990, urban housing was the most expensive category homes, at 150,000 dollars, which was doubled the price of houses in rural areas. The average cost of accommodation in rural areas was $75,000, while suburban housing was higher 25,000 dollars than rural ones. In 2000, the mean housing costs of four groups increased significantly. To specify, urban housing reached 300,000 dollars, which was twice as high as the figure in 1990. In addition, suburban housing costs also rose sharply to $275,000. Finally, there was a dramatic increase to 125,000 dollars, although this remained the lowest figure among the three areas.
Sample Detail
The graph below shows the average cost of housing in three different areas.
19/07/2026 10:25 7.0 points
Topic
The graph below shows the average cost of housing in three different areas.
Word count: 153
Chart/Graph
Essay
Overall Scores
7.0±0.5
Good
Writing Criteria Scores
TA7.0
CC7.0
LR7.0
GRA7.0
Task Achievement7.0
Target: 7.0
Errors:0
Coherence & Cohesion7.0
Target: 7.0
Errors:2
Lexical Resource7.0
Target: 7.0
Errors:3
Grammar & Accuracy7.0
Target: 7.0
Errors:0
Click on any highlighted text in the essay to view detailed suggestions for improvement.
Deep Analysis
Task 1 - Academic Writing
4 tools available
Sample Essay - IELTS Writing Task 1
No sample essay
Click the button below to analyze and generate a high-quality sample essay for Task 1.