
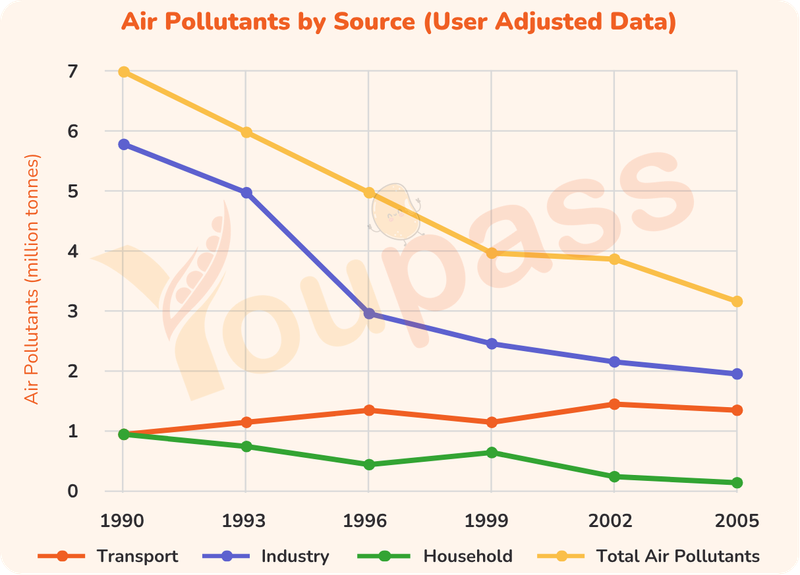
The graph illustrates air contaminant was emitted by a variety of sources in the UK between 1990 and 2005. Overall, it can be seen that the amount of sources caused by air pollutants generally decreased over the period shown. Notably, the figure for industry showed the most noticeable changed, while household consistently maintained the lowest production duration throughout. Regarding UK sources of contamination from 1990 to 1996, the number of sources in which industry stopped increasing around 6 million tonnes, higher than that of transport. The former then consistently followed a downward trend, dropping to 3 million. Meanwhile, both transport and household demonstrate two opposing patterns in 1996, with transport peaked at nearly 2 million by 1996 as well as household witnessed a significantly decreased approximately 1 million. Turning to the remaining years, the figure for household initially decreased and fluctuated from nearly 1 to approximately 0 by 2005. Despite experiencing a slight reduction to nearly 1 million in 1999, air pollutants by transport recovered and reached its peak at roughly 2 million and continually remained in the same figures in 2005. At the same time, industry continually decreased from 3 million to 2 million over the period. In generally, in descending order, the figures were industry, transport and household.
Sample Detail
The graph below shows different sources of air pollutants in the UK from 1990 to 2005. Summarise the information by selecting and reporting the main features, and making comparisons where relevant.
19/07/2026 10:27 5.0 points
Topic
The graph below shows different sources of air pollutants in the UK from 1990 to 2005. Summarise the information by selecting and reporting the main features, and making comparisons where relevant.
Word count: 210
Chart/Graph
Essay
Overall Scores
5.0±0.5
Basic
Writing Criteria Scores
TA5.0
CC6.0
LR5.0
GRA5.0
Task Achievement5.0
Target: 7.0
Errors:0
Coherence & Cohesion6.0
Target: 7.0
Errors:3
Lexical Resource5.0
Target: 7.0
Errors:4
Grammar & Accuracy5.0
Target: 7.0
Errors:0
Click on any highlighted text in the essay to view detailed suggestions for improvement.
Deep Analysis
Task 1 - Academic Writing
4 tools available
Sample Essay - IELTS Writing Task 1
No sample essay
Click the button below to analyze and generate a high-quality sample essay for Task 1.