
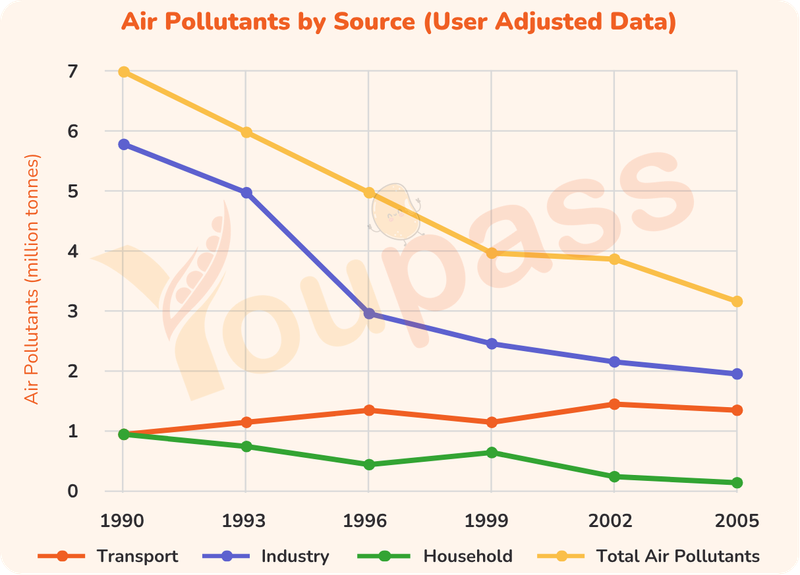
The line graph illustrates the amount of air pollutants emitted by three different sources in the UK between 1990 and 2005. Overall, emissions from all three sources declined over the period. Industry remained by far the largest contributor despite experiencing the sharpest fall, whereas household emissions were consistently the lowest. In 1990, industry produced around 6 million tonnes of air pollutants, considerably more than transport and households, at approximately 1 and 1.5 million tonnes respectively. Industrial emissions then fell steadily to around 3 million tonnes by 1996, while transport emissions increased to nearly 2 million tonnes. In contrast, household emissions declined to about 1 million tonnes. From 1996 onwards, household emissions continued to fall gradually, reaching almost zero by 2005. Although transport emissions dipped slightly in 1999, they recovered to around 2 million tonnes and remained stable thereafter. Meanwhile, industrial emissions continued their downward trend, decreasing from approximately 3 million to 2 million tonnes by the end of the period.
Sample Detail
The graph below shows different sources of air pollutants in the UK from 1990 to 2005. Summarise the information by selecting and reporting the main features, and making comparisons where relevant.
19/07/2026 10:31 6.5 points
Topic
The graph below shows different sources of air pollutants in the UK from 1990 to 2005. Summarise the information by selecting and reporting the main features, and making comparisons where relevant.
Word count: 160
Chart/Graph
Essay
Overall Scores
6.5±0.5
Fair
Writing Criteria Scores
TA6.0
CC7.0
LR7.0
GRA7.0
Task Achievement6.0
Target: 7.0
Errors:1
Coherence & Cohesion7.0
Target: 7.0
Errors:2
Lexical Resource7.0
Target: 7.0
Errors:2
Grammar & Accuracy7.0
Target: 7.0
Errors:0
Click on any highlighted text in the essay to view detailed suggestions for improvement.
Deep Analysis
Task 1 - Academic Writing
4 tools available
Sample Essay - IELTS Writing Task 1
No sample essay
Click the button below to analyze and generate a high-quality sample essay for Task 1.