
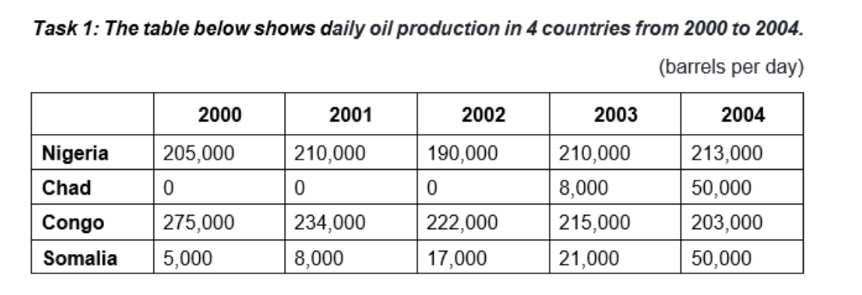
The chart illustrates the amount of oil produced per day in four countries between 2000 and 2004 Overall, there was an increase in the amount of daily oil which was produced in Nigeria, and Somalia, while a gradual decline was seen in Congo.Additionally, Congo produced the most oil among four countries examined, but it was surpassed by Nigeria by the end of the period. In the first 3 years from 2000 to 2002, Chad was the only nation that did not produce oil, after which it started producing and the amount of oil production before ending at 50 thousand barrels per day . The figure for Somalia followed a similar change, rising gradually before reaching the same barrels per day with Chad. 205,000 barrels of oil were produced in Nigeria in 2000, with a subsequent fluctuation and a final growth from 190,000 in 2002 to 213,000 in 2004.The opposite change can be seen in the figure for Congo oil production, which fell significantly from 275,000 to 203,000 in this period
नमूना विवरण
oil
19/07/2026 10:36 7.0 अंक
विषय
oil
शब्दों की संख्या: 170
चार्ट/ग्राफ
Essay
समग्र स्कोर
7.0±0.5
अच्छा
राइटिंग मानदंड स्कोर
TA7.0
CC7.0
LR7.0
GRA7.0
Task Achievement7.0
लक्ष्य: 7.0
त्रुटियां:0
Coherence & Cohesion7.0
लक्ष्य: 7.0
त्रुटियां:1
Lexical Resource7.0
लक्ष्य: 7.0
त्रुटियां:2
Grammar & Accuracy7.0
लक्ष्य: 7.0
त्रुटियां:0
सुधार के विस्तृत सुझाव देखने के लिए लेख में किसी भी हाइलाइट किए गए टेक्स्ट पर क्लिक करें।
गहन विश्लेषण
Task 1 - Academic Writing
4 उपकरण उपलब्ध
नमूना लेख - IELTS Writing Task 1
कोई नमूना लेख नहीं
Task 1 के लिए उच्च-गुणवत्ता वाला नमूना लेख विश्लेषण और बनाने के लिए नीचे दिए गए बटन पर क्लिक करें।