
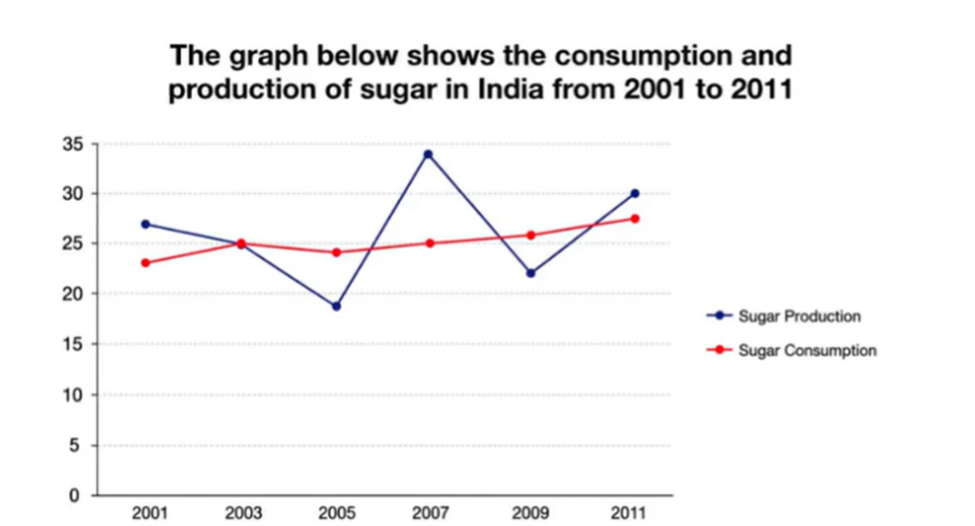
The line graph illustrates the consumption and produciton of sugar in India from 2001 to 10 years later. Overall, the line of the consumption of sugar showed the stability in 10 years. However, had lots of up and down in the line of sugar production. In 2001, the production of sugar was a bit higher than sugar consumption, at roughly 5. But, in 2 years later, the production and consumption of sugar were at the same point, at 25. From 2003 to 2009, the consumption of sugar showed the small change in 6 years, decreased a bit in fist 2 years, at around 24 then grow steadily in 4 years, 25 at 2007 and 26 at 2009. Whereas the sugar production in 2005 had a big decrease to under 20, at around 18 to 19. Then in 2007, the production of sugar had a huge growth up to roughly 35 after that go down to lower than consumption, at around 22. In last year, the line graph showed production increase to 30 and consumption experienced more moderate increases, at around 28.
Detail Sampel
the graph below gives information about sugar production and consumption in India from 2001 to 2011
19/07/2026 11:13 5.5 skor
Topik
the graph below gives information about sugar production and consumption in India from 2001 to 2011
Jumlah kata: 181
Grafik/Diagram
Essay
Skor Keseluruhan
5.5±0.5
Dasar
Skor Kriteria Writing
TA6.0
CC6.0
LR6.0
GRA5.0
Task Achievement6.0
Target: 7.0
Kesalahan:1
Coherence & Cohesion6.0
Target: 7.0
Kesalahan:5
Lexical Resource6.0
Target: 7.0
Kesalahan:7
Grammar & Accuracy5.0
Target: 7.0
Kesalahan:0
Klik teks yang ditandai di esai untuk melihat saran detail untuk peningkatan.
Analisis mendalam
Task 1 - Academic Writing
4 tools available
Esai contoh - IELTS Writing Task 1
Belum ada esai contoh
Silakan klik tombol di bawah untuk menganalisis dan membuat esai contoh berkualitas tinggi untuk Task 1.