
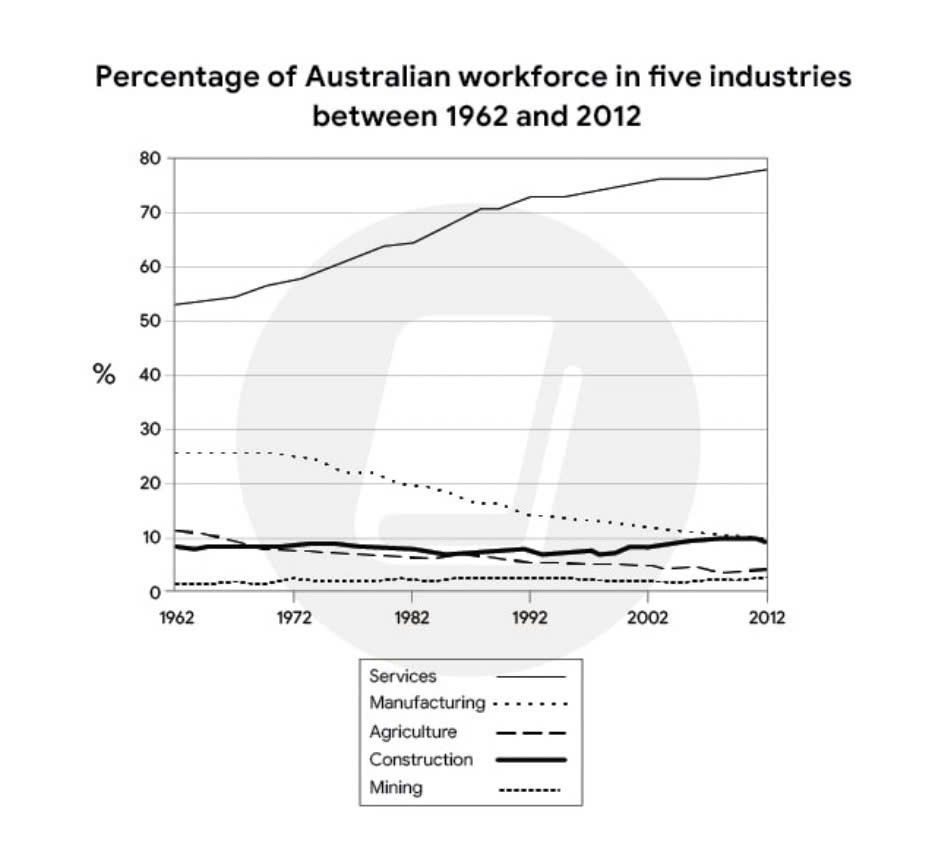
The provided line graph illustrates the percentage of Australian employees in five industry categories over a period of five decades, starting from 1962. Overall, it could be seen that the percentage of employees in Manufacturing and Agriculture all followed a downward trend. By contract, the figures for Service and Construction increased by the end of the period. Looking first at the Service industry, it started around 53 percent in 1962 and gradually increased to nearly 80 percent by the end of the period. A similar upward trend, though at a much lower level,was observed in Construction where the percentage of workforce fluctuated slightly but still rose about 5% to 10% in 2012. Over the following five decades, the figures for the three other industries showed different. Specifically, Manufacturing started á the second highest sector at 25 percent in 1962, but it dropped steadily to around 10 percent by 2012. A similar downward trend was seen in Agriculture, which began at around 11% before decreasing to under 5% at the end of timeline. In contrast, Mining remained the lowest throughout the period, staying stable and hovering just below 5%.
รายละเอียดตัวอย่าง
The graph below illustrates the proportion of the Australian workforce employed in five industries over the period from 1962 to 2012.
19/07/2026 11:25 6.5 คะแนน
หัวข้อ
The graph below illustrates the proportion of the Australian workforce employed in five industries over the period from 1962 to 2012.
จำนวนคำ: 188
แผนภูมิ/กราฟ
Essay
คะแนนรวม
6.5±0.5
ดีพอใช้
คะแนนเกณฑ์การเขียน
TA6.0
CC7.0
LR6.0
GRA7.0
Task Achievement6.0
เป้าหมาย: 7.0
ข้อผิดพลาด:0
Coherence & Cohesion7.0
เป้าหมาย: 7.0
ข้อผิดพลาด:3
Lexical Resource6.0
เป้าหมาย: 7.0
ข้อผิดพลาด:3
Grammar & Accuracy7.0
เป้าหมาย: 7.0
ข้อผิดพลาด:0
คลิกข้อความที่ไฮไลต์ในเรียงความเพื่อดูคำแนะนำรายละเอียดเพื่อพัฒนา
การวิเคราะห์เชิงลึก
Task 1 - Academic Writing
4 tools available
บทความตัวอย่าง - IELTS Writing Task 1
ยังไม่มีบทความตัวอย่าง
กดปุ่มด้านล่างเพื่อวิเคราะห์และสร้างบทความตัวอย่างคุณภาพสูงสำหรับ Task 1