
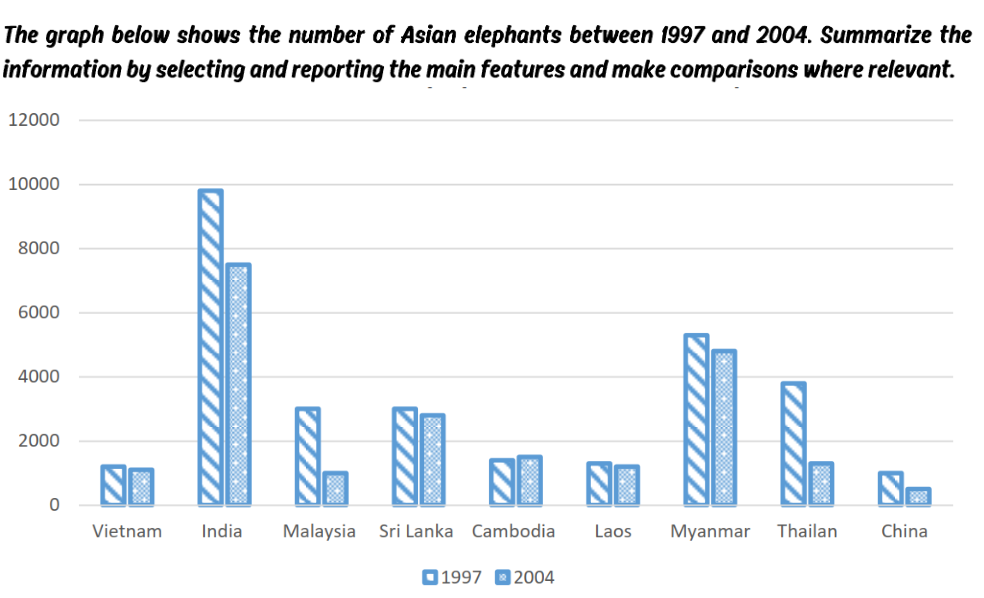
The chart compares the number of Asian elephants from 1997 to 2004. Overall, it can be seen that the number of India elephants were the highest figure in the 1997-2004 period. By contrast, those of China were the lowest stastistic in the same period. In 1997, elephants of India were the highest figure, peaking at 10000 ones; however, there was a significant decrease in the number of elephants in 2004, decreasing to over 7000 ones. Myanmar's elephants were roughly 6000 ones, twice as high as than those of Malaysia and Sri Lanka, just over 3000 ones. In Thailan, the number of elephants decreased twofold, from roughly 4000 to under 2000 ones There was a slightly decrease in the number of elephants in Vietnam and Laos were under 2000 ones between 1997 and 2004. China had roughly 1000 elephants in 1997, which was the lowest figure. China's elephants decreased twofold in 2004, at approximately 500 ones.
Detail Sampel
WRITING DYNAMIC >3 subjects The graph below shows the number of Asian elephants between 1997 and 2004. Summarise the information by selecting and reporting the main features, and make comparisons where relevant.
19/07/2026 16:28 6.0 skor
Topik
WRITING DYNAMIC >3 subjects The graph below shows the number of Asian elephants between 1997 and 2004. Summarise the information by selecting and reporting the main features, and make comparisons where relevant.
Jumlah kata: 155
Grafik/Diagram
Essay
Skor Keseluruhan
6.0±0.5
Cukup
Skor Kriteria Writing
TA6.0
CC6.0
LR6.0
GRA6.0
Klik teks yang ditandai di esai untuk melihat saran detail untuk peningkatan.
Analisis mendalam
Task 1 - Academic Writing
4 tools available
Esai contoh - IELTS Writing Task 1
Belum ada esai contoh
Silakan klik tombol di bawah untuk menganalisis dan membuat esai contoh berkualitas tinggi untuk Task 1.