
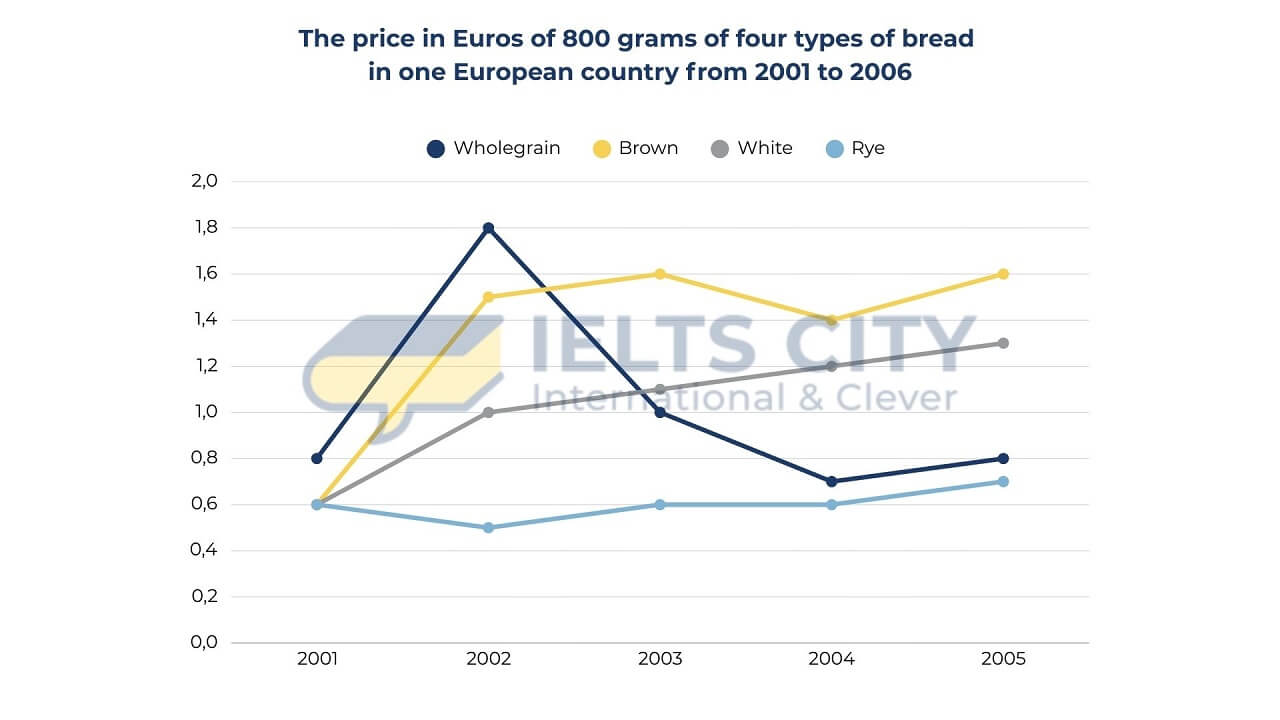
According to the line graph, it demonstrates the cost of 800 grams of four types of bread in Euros in one European country between 2001 and 2005. Overall, most of the types of bread increased during the period. Brown received the most expensive bread while Rye remained the cheapest price. White mostly rose during the period while after many changes, Wholegrain remained the same amount of cost. Looking at the graph, Rye only had 0,6 in 2001 which received the cheapest of four types. There was a small drop in the next year before remaining the same in 2003. It slightly rose until 2005. Brown which had the same amount of Rye, significantly increased in 2002 and slightly went up to 1,6 in 2003. There was a small decline in the the next year but it increased back in 2005. In addition, White which had the same amount of price with Brown and Rye, had a big growth in 2002 and gradually rose until 2005. Wholegrain sharply rose in 2002 which accounted 1,8 Euros but it significantly dropped in 2003. It had a small decrease in 2004 before slightly increasing in 2005.
Sample Detail
The chart below shows the price in Euros of 800 grams of four types of bread in one European country from 2001 to 2005. Summarize the information by selecting and reporting the main features, and make comparisons where relevant.
19/07/2026 16:36 6.5 points
Topic
The chart below shows the price in Euros of 800 grams of four types of bread in one European country from 2001 to 2005. Summarize the information by selecting and reporting the main features, and make comparisons where relevant.
Word count: 192
Chart/Graph
Essay
Overall Scores
6.5±0.5
Fair
Writing Criteria Scores
TA7.0
CC7.0
LR6.0
GRA6.0
Click on any highlighted text in the essay to view detailed suggestions for improvement.
Deep Analysis
Task 1 - Academic Writing
4 tools available
Sample Essay - IELTS Writing Task 1
No sample essay
Click the button below to analyze and generate a high-quality sample essay for Task 1.