
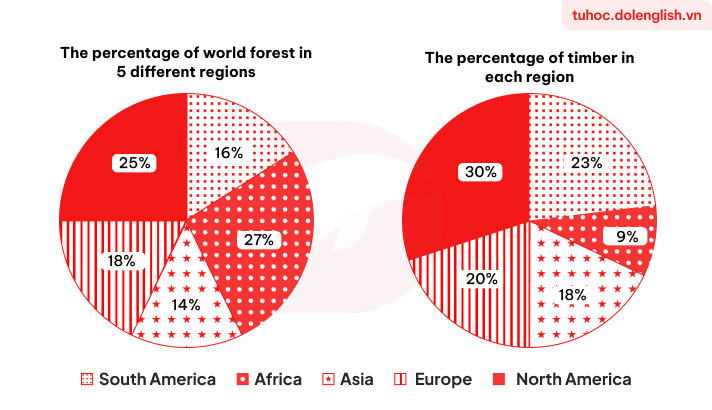
The charts provide information on the proportion of the forest in five different regions in the world and the amount of timber in each region. Generally, most of the survey area experienced a rate of wool that is more than the percentage of forest, with only exception. An examination of the proportion of the forest in South America, Asia, Europe, and North America reveal a lower rate than timber in each region. The percentage of forest in North America was recorded at 25%, which is lower than timber by 5%, followed by the forest in Asia lower than timber 4% which account for 18%. South America accounted for only 16% forest, while it's rate in timber is higher by 7%. Europe also have the difference percentage, the proportion of forest is 18% that lower than timber by 2% However, an examination of the percantage of the forest in Africa reveal an astonishing number with 27%, which is the highest rate of forest. While the percentage of timber in Africa recorded the lowest number at only 9%, which was only one-third compared to forest.
รายละเอียดตัวอย่าง
The pie charts give information about the world’s forests in five different regions. Summarize the information by selecting and reporting the main features, and make comparisons where relevant.
19/07/2026 17:02 6.0 คะแนน
หัวข้อ
The pie charts give information about the world’s forests in five different regions. Summarize the information by selecting and reporting the main features, and make comparisons where relevant.
จำนวนคำ: 183
แผนภูมิ/กราฟ
Essay
คะแนนรวม
6.0±0.5
ดีพอใช้
คะแนนเกณฑ์การเขียน
TA6.0
CC7.0
LR5.0
GRA6.0
คลิกข้อความที่ไฮไลต์ในเรียงความเพื่อดูคำแนะนำรายละเอียดเพื่อพัฒนา
การวิเคราะห์เชิงลึก
Task 1 - Academic Writing
4 tools available
บทความตัวอย่าง - IELTS Writing Task 1
ยังไม่มีบทความตัวอย่าง
กดปุ่มด้านล่างเพื่อวิเคราะห์และสร้างบทความตัวอย่างคุณภาพสูงสำหรับ Task 1