
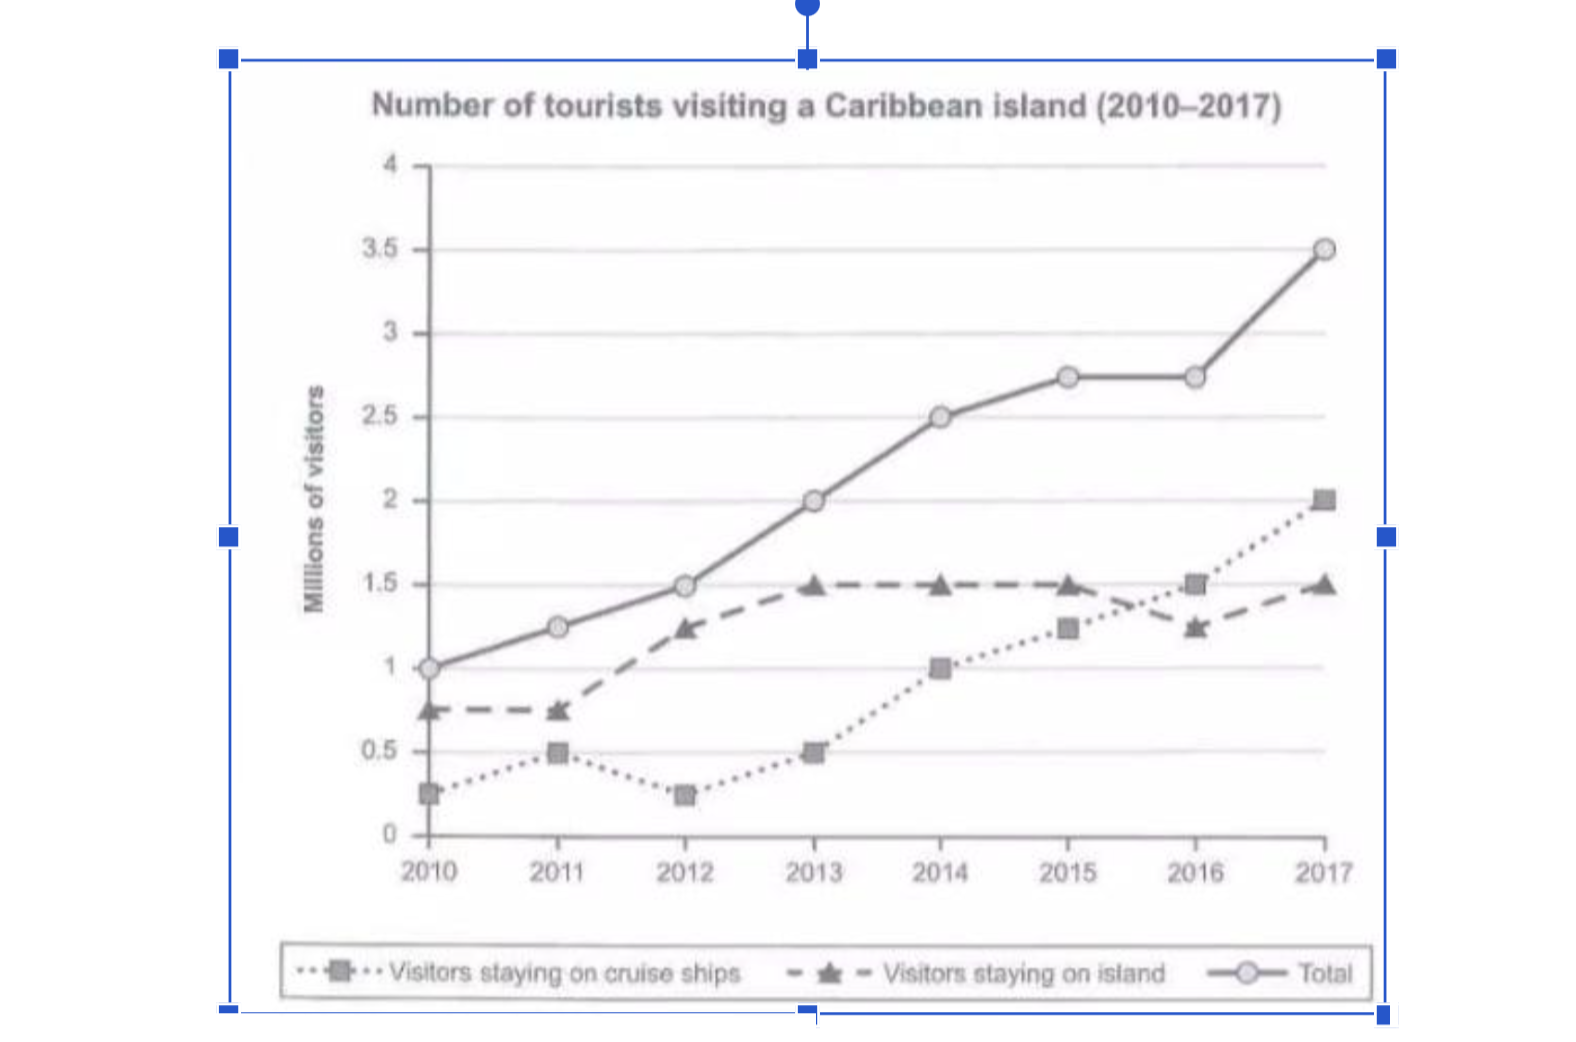
The line graph provides date on the amount of visitors travelling to Caribbean island over a 8-year period starting from 2010. What is most striking when looking at the picture is the total, visitors staying on island and staying on cruise ships saw net increases in number of tourists. It is also important to note that the total visitors remained the highest number of traveler in the Caribbean island throughout. Looking first at visitors staying on island and total, the latter increases during the given timeframe, it rose from 1 millions to 1.5 millions in 3 years. From 2012 it sharply climbed to about 2.7 millions over 4 years and it reached a peak of 3.5 millions of visitors in 2017 and stayed the highest position in the line graph. The former slightly increased from 0.7 to 1.5 in the first 4 years and then remained unchanged 3 years later until 2015, it fluctuated from 2015 to 2017. Moving on to the figure of visitors staying on the cruise ships, it was easy to see that point grown in the two first year and then hit a low of 0.25 in 2012 which was the lowest point in the line graph. However, it rapidly increased until 2015 and reached 1.25, between 2015 and 2016, it overtook with the visitors staying on island and continued to rose to 2 millions in 2017 and claimed the second place in the graph.
Sample Detail
The line graph below shows the number of tourists visiting a Caribbean island from 2010 to 2017.
19/07/2026 17:14 6.0 points
Topic
The line graph below shows the number of tourists visiting a Caribbean island from 2010 to 2017.
Word count: 239
Chart/Graph
Essay
Overall Scores
6.0±0.5
Fair
Writing Criteria Scores
TA6.0
CC7.0
LR6.0
GRA6.0
Click on any highlighted text in the essay to view detailed suggestions for improvement.
Deep Analysis
Task 1 - Academic Writing
4 tools available
Sample Essay - IELTS Writing Task 1
No sample essay
Click the button below to analyze and generate a high-quality sample essay for Task 1.