
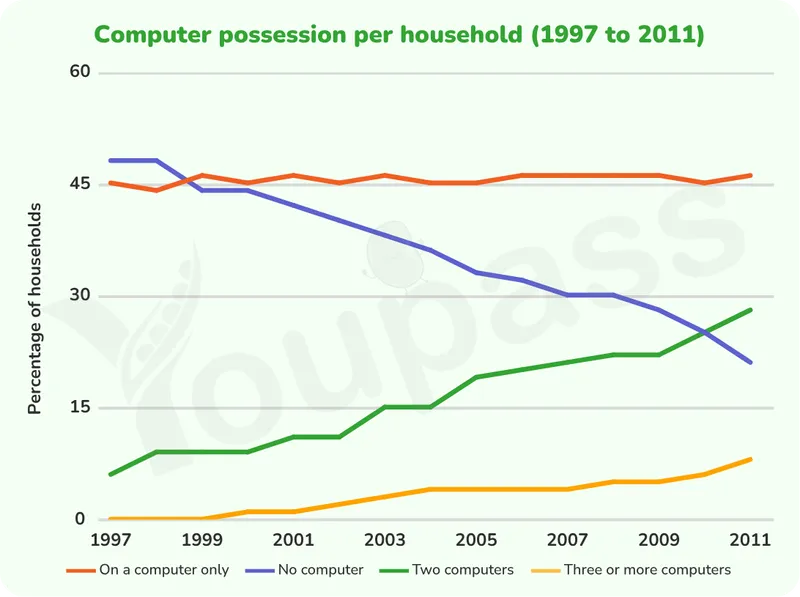
The line chart compares the number of households with computer possession in a European country in 14 consecutive years, beginning in 1997. Overall, the percentages of households with two or more computers climbed throughout the period; meanwhile, the tendency to purchase computers caused a decline in the figure for households with no computers. On the other hand, households possessing one computer accounted for a consistent percentage in the same period. In terms of two computers and three or more computers, they initially both started at a low level. However, after 14 years, they then increased considerably from around 7% to nearly 30% and from 0% to approximately 8% in 2011, respectively. Concerning the other sectors, in 1997 the percentages of households with one or no computers were roughly 45%. The trajectory for one computer was stable at the same initial level, 45%. In contrast, the figure for no computer was highest in 1997, but then it dropped significantly to just about 20%, making it third-ranking.
नमूना विवरण
The graph below gives information about computer possession by households in one European country between 1997 and 2011. Summarise the information by selecting and reporting the main features, and make comparisons where relevant.
19/07/2026 17:15 7.0 अंक
विषय
The graph below gives information about computer possession by households in one European country between 1997 and 2011. Summarise the information by selecting and reporting the main features, and make comparisons where relevant.
शब्दों की संख्या: 165
चार्ट/ग्राफ
Essay
समग्र स्कोर
7.0±0.5
अच्छा
राइटिंग मानदंड स्कोर
TA7.0
CC7.0
LR7.0
GRA7.0
सुधार के विस्तृत सुझाव देखने के लिए लेख में किसी भी हाइलाइट किए गए टेक्स्ट पर क्लिक करें।
गहन विश्लेषण
Task 1 - Academic Writing
4 उपकरण उपलब्ध
नमूना लेख - IELTS Writing Task 1
कोई नमूना लेख नहीं
Task 1 के लिए उच्च-गुणवत्ता वाला नमूना लेख विश्लेषण और बनाने के लिए नीचे दिए गए बटन पर क्लिक करें।