
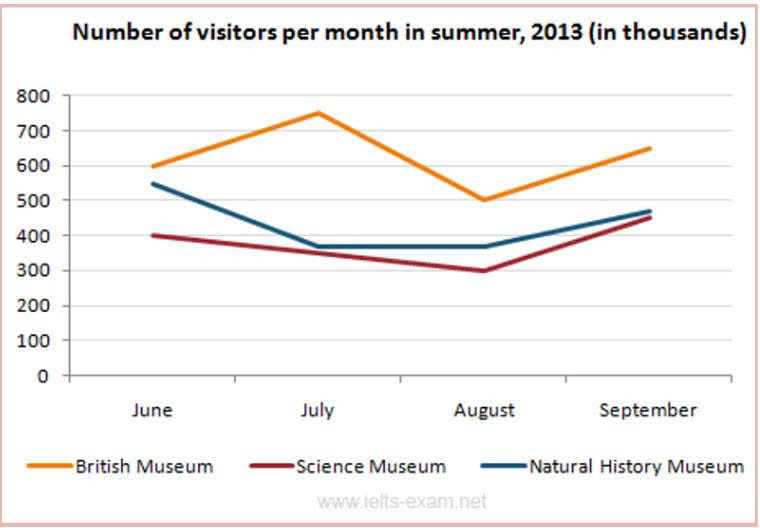
The given line graph illustrates how many people visited three museums in London from June to September in 2013. Overall, there was upward trends in 3 different types of country. Addtional, the number of visitors in British Museum has the highest figures, while it was opposite for Natural History Museum Starting 600,000 visitors in june, the number of visitors in British Museum increased significantly yo around 750,000 visitors in july. In addtion to, the figures for British Museum decreased considerbly to 500,000 visitors after 1 month, and this figure climbed to only 650,000 visitors in September Looking 550,000 visitors in June, the number of Visitors in Science Museum declined subsequently by 70,000 visitors and this figure remained unchanged to August. Additionally, this fugure went up slightly by 100,000 visitors in September. Visitors in Natural History Museum in June stood at 550,000, and this figure went down significanly to 300,000 visitors in August and increased only 450,000 visitors.
Detail Sampel
The given line graph show how many people visited three museums in London from June to September in 2013.
19/07/2026 18:01 5.0 skor
Topik
The given line graph show how many people visited three museums in London from June to September in 2013.
Jumlah kata: 157
Grafik/Diagram
Essay
Skor Keseluruhan
5.0±0.5
Dasar
Skor Kriteria Writing
TA5.0
CC5.0
LR5.0
GRA5.0
Klik teks yang ditandai di esai untuk melihat saran detail untuk peningkatan.
Analisis mendalam
Task 1 - Academic Writing
4 tools available
Esai contoh - IELTS Writing Task 1
Belum ada esai contoh
Silakan klik tombol di bawah untuk menganalisis dan membuat esai contoh berkualitas tinggi untuk Task 1.