
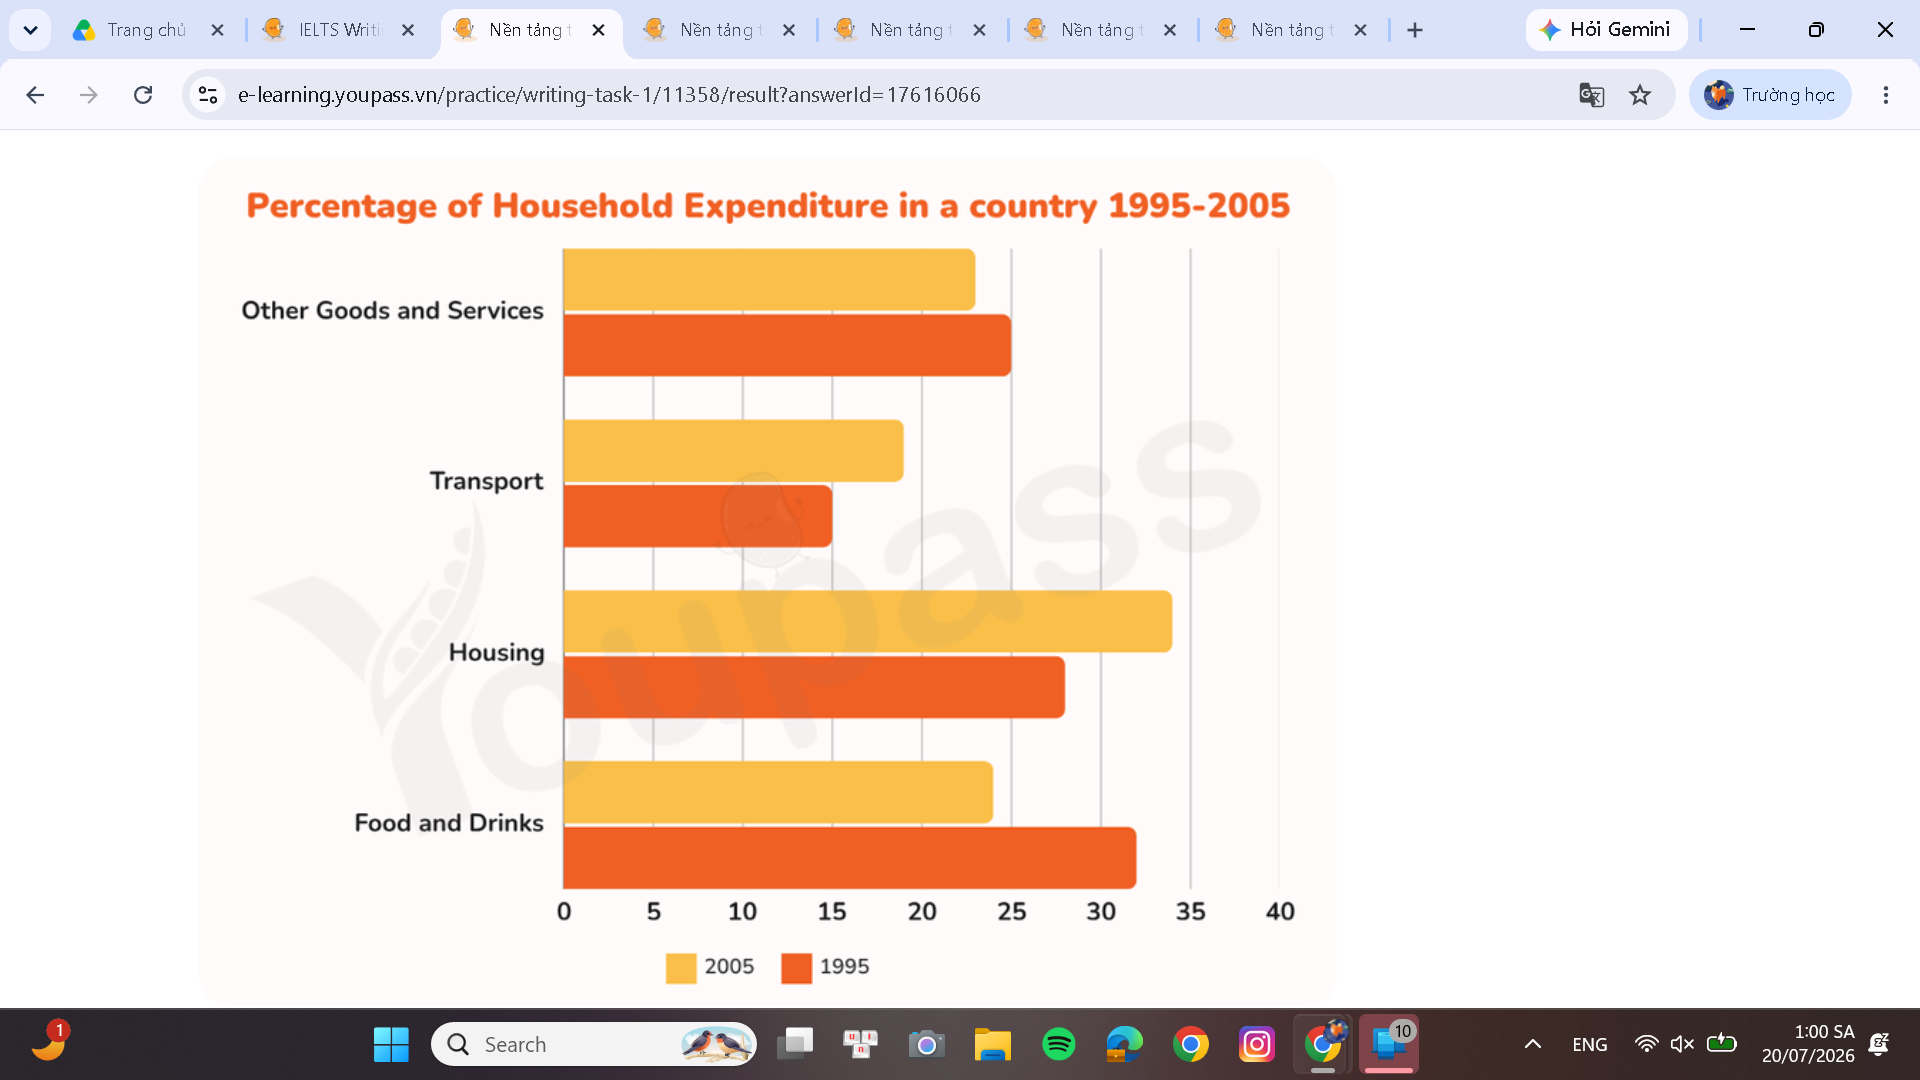
The chart illustrate the prportion of household expenditure on goods and services in a country from 1995 to 2005. Overall, it is evident that housing expenditure devoted the greatest proportion of their expenditure in 2005, wheares food and drinks was the highest percentage of household spending in 1995. Transport was the lowest proportion in remaining categories in both years 1995 and 2005. Focusing on housing, this category was the highest expenditure in 2005, accounting for approximately 35%, wheares this figure just at 27% in 1995. Similar trend can be observed in transport, the percentage of household expenditure on this category stood at 15% in 1995, before rising to 17% in 2005. Turning on Food and Drinks, the proportion of household expenditure on food and beverages was the highest spending in 1995, accounting for roughly 33%, before dropping considerably to 23% in 2005. With regard to other goods and services, this figure remained relatively stable from 1995 to 2005. A particularly, the percentage of household spending of its was 25% in 1995 and declining slightly to 22% in 2005, this figure was relatively similar with those of the percentage of food and drinks in the same year.
नमूना विवरण
The two line graphs show the changes in UK steel demand and employment in the steel industry between 1970 and 2000. Summarise the information by selecting and reporting the main features, and make comparisons where relevant.
19/07/2026 18:06 5.5 अंक
विषय
The two line graphs show the changes in UK steel demand and employment in the steel industry between 1970 and 2000. Summarise the information by selecting and reporting the main features, and make comparisons where relevant.
शब्दों की संख्या: 196
चार्ट/ग्राफ
Essay
समग्र स्कोर
5.5±0.5
बुनियादी
राइटिंग मानदंड स्कोर
TA6.0
CC6.0
LR5.0
GRA6.0
सुधार के विस्तृत सुझाव देखने के लिए लेख में किसी भी हाइलाइट किए गए टेक्स्ट पर क्लिक करें।
गहन विश्लेषण
Task 1 - Academic Writing
4 उपकरण उपलब्ध
नमूना लेख - IELTS Writing Task 1
कोई नमूना लेख नहीं
Task 1 के लिए उच्च-गुणवत्ता वाला नमूना लेख विश्लेषण और बनाने के लिए नीचे दिए गए बटन पर क्लिक करें।