
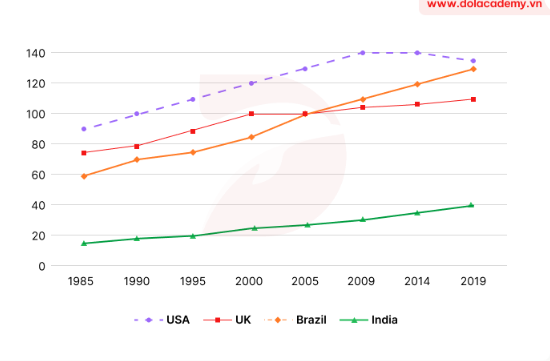
The statistics illustrate per capita meat consumption in four countries( the USA, the UK, Brazil, and India) over a 34-year period, starting from 1985. Overall, what is notable from the chart is that all meat consumption witnessed an upward trend in four countries. Additionally, among all the figures, the USA held the top spot during the entire surveyed period. At the start of the period, with approximately 90kg, the USA held the highest position. Slightly below were the UK and Brazil, with corresponding figures being 78kg and 60kg. At the bottom of the list was India, as its figure stood at nearly 20kg. Thereafter, there was a sharply increased in the USA and hit a peak of 140kg in the number of meat consumption in 2009, before a slight decrease in 2019 with 136kg was recorded. Similarly, an increase to nearly 140kg was recorded in the number of meat consumption to Brazil in 2019. At the same time, the UK witnessed a descending trend in the number of meat consumption, with a notice rise to 100kg in 2000, and remained unchanged, followed by a slight rise to 112kg. Finally, a upward shift was recorded in the proportion of meat consumption, with 40kg in 2019.
Detail Sampel
The line chart shows the per capita meat consumption in four different countries (USA, UK, India, Brazil) from 1985 to 2019.
19/07/2026 18:47 6.0 skor
Topik
The line chart shows the per capita meat consumption in four different countries (USA, UK, India, Brazil) from 1985 to 2019.
Jumlah kata: 204
Grafik/Diagram
Essay
Skor Keseluruhan
6.0±0.5
Cukup
Skor Kriteria Writing
TA6.0
CC6.0
LR6.0
GRA6.0
Klik teks yang ditandai di esai untuk melihat saran detail untuk peningkatan.
Analisis mendalam
Task 1 - Academic Writing
4 tools available
Esai contoh - IELTS Writing Task 1
Belum ada esai contoh
Silakan klik tombol di bawah untuk menganalisis dan membuat esai contoh berkualitas tinggi untuk Task 1.