
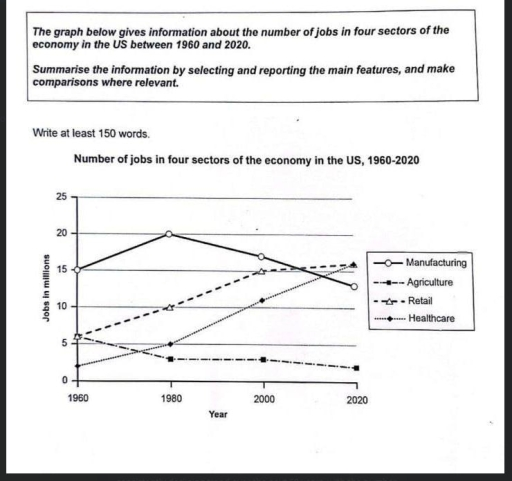
The line chart illustrates how many jobs were available across four industries in the US economy from 1960 to 2020. Overall, manufacturing and agriculture provided fewer jobs over time, whereas healthcare and retail experienced the reverse trend. Additionally, manufacturing remained the largest employer for the majority of the period, before ceding its dominance to retail and healthcare by the end. Looking firstly at manufacturing and agriculture, these sectors became less prominent sources of employment over the period. The first two decades witnessed opposite trends across the two sectors. Specifically, manufacturing dominated the job market during this period, with job numbers climbing from 15 million to a peak of 20 million in 1980. In contrast, agriculture saw a reduction from approximately 6 million to roughly 3 million jobs over the same time frame. The rest of the period documented a general decline across both sectors. While a plunge of around 7 million jobs was seen in manufacturing, those in agriculture leveled off from 1980 to 2000, prior to a slight decline to about 2 million in 2020, leaving this sector as the smallest job provider among the four industries. In contrast, healthcare and retail expanded their share of the job market over time. Initially, retail was the larger job provider of the two, supplying about 6 million positions compared to roughly 2 million in healthcare. Over the following forty years, both sectors experienced a comparable increase of approximately 9 million jobs. By the end of the period, retail jobs had reached nearly 16 million. Healthcare exhibited a faster rise, eventually matching retail, with both sectors overtaking manufacturing to become the leading job providers.
नमूना विवरण
The graph below gives information about then number of jobs in four sectors of the economy in the US between 1960 and 2020.
19/07/2026 19:18 8.0 अंक
विषय
The graph below gives information about then number of jobs in four sectors of the economy in the US between 1960 and 2020.
शब्दों की संख्या: 272
चार्ट/ग्राफ
Essay
समग्र स्कोर
8.0±0.5
उत्कृष्ट
राइटिंग मानदंड स्कोर
TA8.0
CC8.0
LR8.0
GRA8.0
सुधार के विस्तृत सुझाव देखने के लिए लेख में किसी भी हाइलाइट किए गए टेक्स्ट पर क्लिक करें।
गहन विश्लेषण
Task 1 - Academic Writing
4 उपकरण उपलब्ध
नमूना लेख - IELTS Writing Task 1
कोई नमूना लेख नहीं
Task 1 के लिए उच्च-गुणवत्ता वाला नमूना लेख विश्लेषण और बनाने के लिए नीचे दिए गए बटन पर क्लिक करें।