
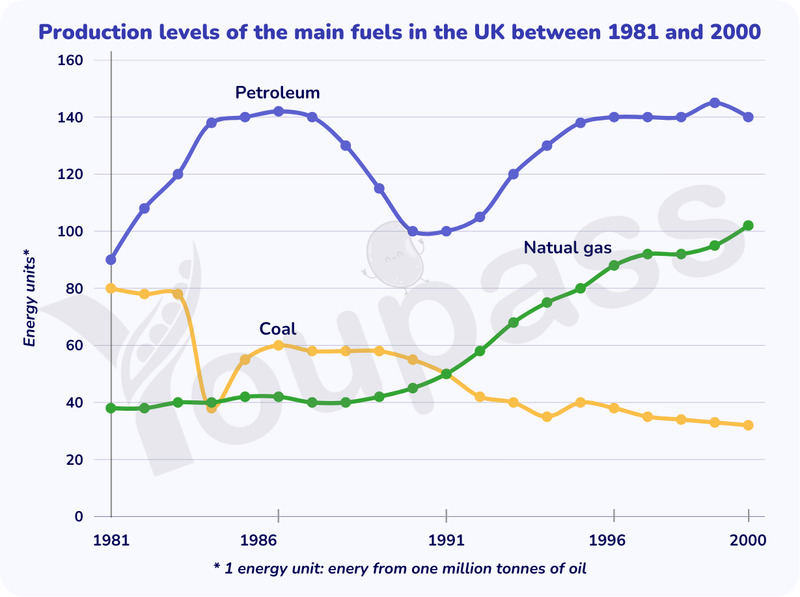
The chart depicts the major types of fuel output in the UK over a 19-year period starting from 1981. Overall, Petroleum experienced wild fluctuations but it was the highest. Meanwhile, Coal drop gradually and it was undertaken by Natual gas, which saw a stead increase. In 1981, Petroleum stood at nearly 90 enrgy units, which was followed by an increase to 142 energy units in 1986. A significant decrease to 100 energy units was seen in Petroleum from 1986 to 1991. It then rise sharply, reaching a high of 145 energy units and finally at 140 energy units in 2000. Petroleum was the most productive throughout the period. Coal was recorded at 80 energy units in 1981, 10 energy units lower than Petroleum in the same year. Between 1981 and 1984, Coal suffered a rapid fall, hitting a low of nearly 40 energy units in 1984. From 1984 to 2000, there was a stead drop to 32 energy units in Coal. In 1981, Natual gas stood at approximately 40 energy units. From 1981 to 1991, Natual grew marginally to 60 energy units and Coal was exceeded by Natual gas. There was a significant growth from 60 to 100 energy units over a 9-year period starting from 1991.
Detail Sampel
The graph below shows the production levels of the main kinds of fuel in the UK between 1981 and 2000.
20/07/2026 03:50 6.5 skor
Topik
The graph below shows the production levels of the main kinds of fuel in the UK between 1981 and 2000.
Jumlah kata: 207
Grafik/Diagram
Essay
Skor Keseluruhan
6.5±0.5
Cukup
Skor Kriteria Writing
TA7.0
CC7.0
LR6.0
GRA7.0
Klik teks yang ditandai di esai untuk melihat saran detail untuk peningkatan.
Analisis mendalam
Task 1 - Academic Writing
4 tools available
Esai contoh - IELTS Writing Task 1
Belum ada esai contoh
Silakan klik tombol di bawah untuk menganalisis dan membuat esai contoh berkualitas tinggi untuk Task 1.