
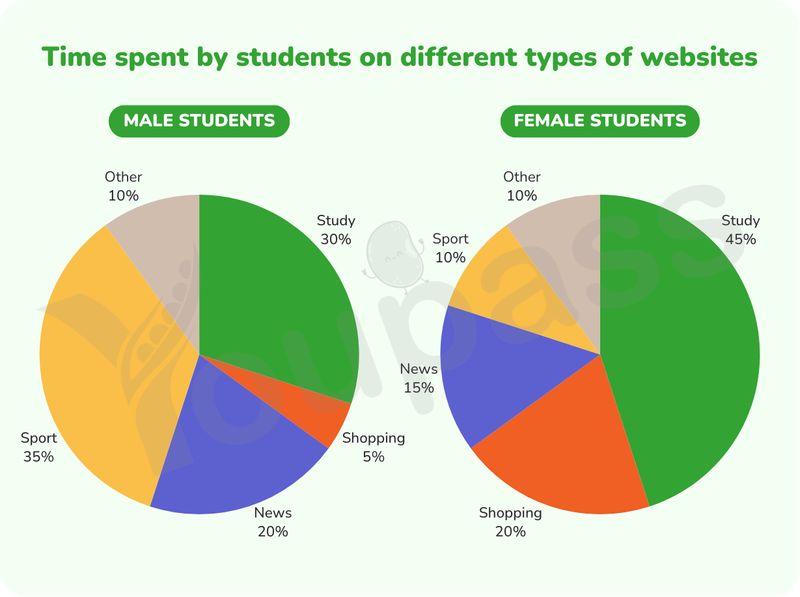
Two pie graphs demonstrate the rate of time that man and woman students allocate to five various types of websites. Overall, it can be seen that sport websites account for the most percentage of male students' time while female students spend most of their time on study websites. Time spent on other applications are similar between female and male students, which occupy 10%. On the one hand, sport websites constitude 35% of the total time spent on various applications by man students, closely followed by study websites with 30%. Moreover, news applications take up 20% of man students' time, significantly higher than time spent on shopping websites, which account for 5%. On the other hand, woman students' time spent on study applications is the highest, which occupy 45% of the total. In contrast, woman students allocate only 10% of their total time to sport websites. In comparison with shopping applications, which make up 20% of the total, those of news are lower by 5 percentage points.
নমুনা বিস্তারিত
The charts below illustrate the percentage of time that male and female students spend on five different types of websites. Summarise the information by selecting and reporting the main features, and make comparisons where relevant.
20/07/2026 03:59 6.5 স্কোর
টপিক বা বিষয়
The charts below illustrate the percentage of time that male and female students spend on five different types of websites. Summarise the information by selecting and reporting the main features, and make comparisons where relevant.
শব্দ সংখ্যা: 166
চার্ট/গ্রাফ
Essay
সামগ্রিক স্কোর
6.5±0.5
মোটামুটি
রাইটিং মানদণ্ড স্কোর
TA7.0
CC7.0
LR6.0
GRA7.0
উন্নতির জন্য বিস্তারিত পরামর্শ দেখতে প্রবন্ধের হাইলাইট করা যেকোনো লেখায় ক্লিক করুন।
গভীর বিশ্লেষণ
Task 1 - Academic Writing
4 tools available
নমুনা রচনা - IELTS Writing Task 1
কোনো নমুনা রচনা নেই
টাস্ক ১-এর জন্য উচ্চমানের নমুনা রচনা বিশ্লেষণ এবং তৈরি করতে নিচের বাটনে ক্লিক করুন।