
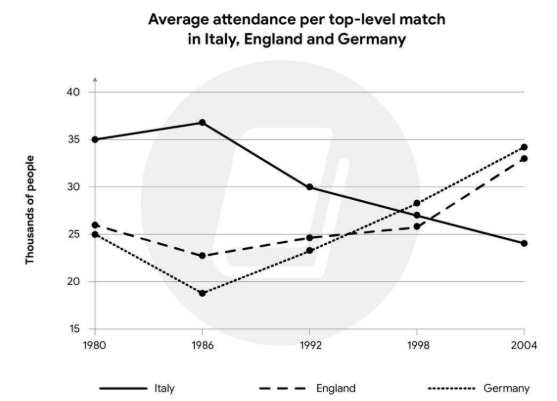
The line graph illustrates how the average number of participants attending top-level football matches changed in three different countries in Europe (Italy, England and Germany) between 1980 and 2004. Overall, the average number of average attendance in Italy decreased significantly, while those of England and Germany increased markedly over the period. Looking first at Italy, this country had the highest attendance, at 35 thousand of people in 1980 before its figure rise slightly to around 37 thousand in the next year. However, it witnessed a considerable fall to just under 25 thousand in 2004, thereby making Italy with the lowest number of participants. Turning to England and Germany, these nations saw a remarkable growth throughout the years. The number of attendees in England declined modestly from 26 thousand in 1980 to approximately 23 thousand in 1986 before recovering to its initial level in 1998 and surging to 34 thousand in 2004. Similarly, Germany’s figure plummeted from 25 to 18 thousand in the first two years, but the number climbed again and reached its peak of nearly 35 thousand in the final year, overtaking that of England and becoming the dominant country which had the highest attendance.
Sample Detail
The graph below shows the average number of people attending top-level football matches in three European countries from 1980 to 2004.
20/07/2026 04:18 7.0 points
Topic
The graph below shows the average number of people attending top-level football matches in three European countries from 1980 to 2004.
Word count: 196
Chart/Graph
Essay
Overall Scores
7.0±0.5
Good
Writing Criteria Scores
TA7.0
CC7.0
LR7.0
GRA7.0
Click on any highlighted text in the essay to view detailed suggestions for improvement.
Deep Analysis
Task 1 - Academic Writing
4 tools available
Sample Essay - IELTS Writing Task 1
No sample essay
Click the button below to analyze and generate a high-quality sample essay for Task 1.