
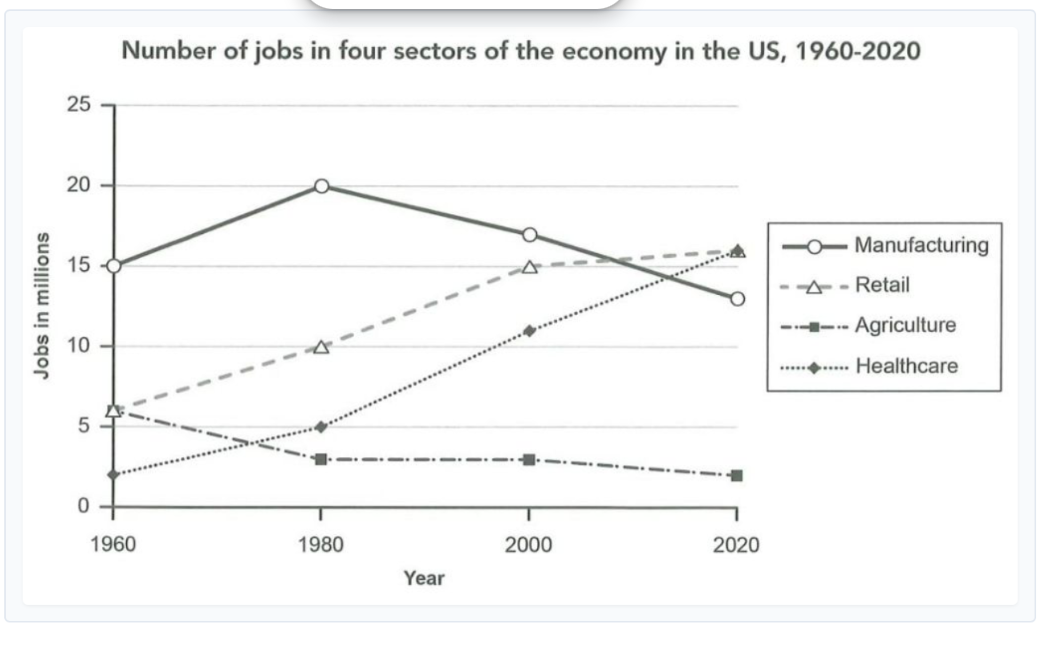
The line graph illustrates the amount of jobs in four different sectors of the economy in the US from 1960 to 2020. Overall, manufacturing was the largest employer at the beginning of the period, despite experiencing a downward trend in 1980. Agriculture also followed the same pattern. In contrast, retail and healthcare experienced an opposite trend which showed significant growth throughout the time period, then became the two biggest sectors at the end of the period. Started with manufacturing, which sector had the most employers, accounting for 15 million jobs at the beginning of the period. This figure went up to a peak at 20 million in 1980 before experiencing a downward trend to around 13 million in 2020, this sector also lost its leading position. Moreover, healthcare had the same trend with manufacturing while it started at nearly 6 million jobs in 1960, then proficiency underwent a decline to about 3 million in 1980 then reached bottom at approximately 2 million at the end of the period, becoming the smallest sector of the US economy. Turning to retail and healthcare, both sectors show a significant growth throughout the period. Healthcare began with about 3 million jobs then increased to 5 million in 1980, then experienced a significant growth in 1980, overtaking all other sectors to reach a peak at nearly 16 million at the end of the period. Retail also followed the same trend, which started at 6 million jobs, and experienced an upward trend to 10 million in 1980, then its continued rising to reach 16 million in 2020. Both sectors became the largest sectors of the economy in the US at the end of the period in 2020.
नमूना विवरण
The graph below gives information about the number of jobs in four sectors of the economy in the US between 1960 and 2020.Summarize the information by selecting and reporting the main features, and make comparisons where relevant. Write at least 150 words.
20/07/2026 04:34 5.5 अंक
विषय
The graph below gives information about the number of jobs in four sectors of the economy in the US between 1960 and 2020.Summarize the information by selecting and reporting the main features, and make comparisons where relevant. Write at least 150 words.
शब्दों की संख्या: 281
चार्ट/ग्राफ
Essay
समग्र स्कोर
5.5±0.5
बुनियादी
राइटिंग मानदंड स्कोर
TA5.0
CC6.0
LR6.0
GRA6.0
सुधार के विस्तृत सुझाव देखने के लिए लेख में किसी भी हाइलाइट किए गए टेक्स्ट पर क्लिक करें।
गहन विश्लेषण
Task 1 - Academic Writing
4 उपकरण उपलब्ध
नमूना लेख - IELTS Writing Task 1
कोई नमूना लेख नहीं
Task 1 के लिए उच्च-गुणवत्ता वाला नमूना लेख विश्लेषण और बनाने के लिए नीचे दिए गए बटन पर क्लिक करें।