
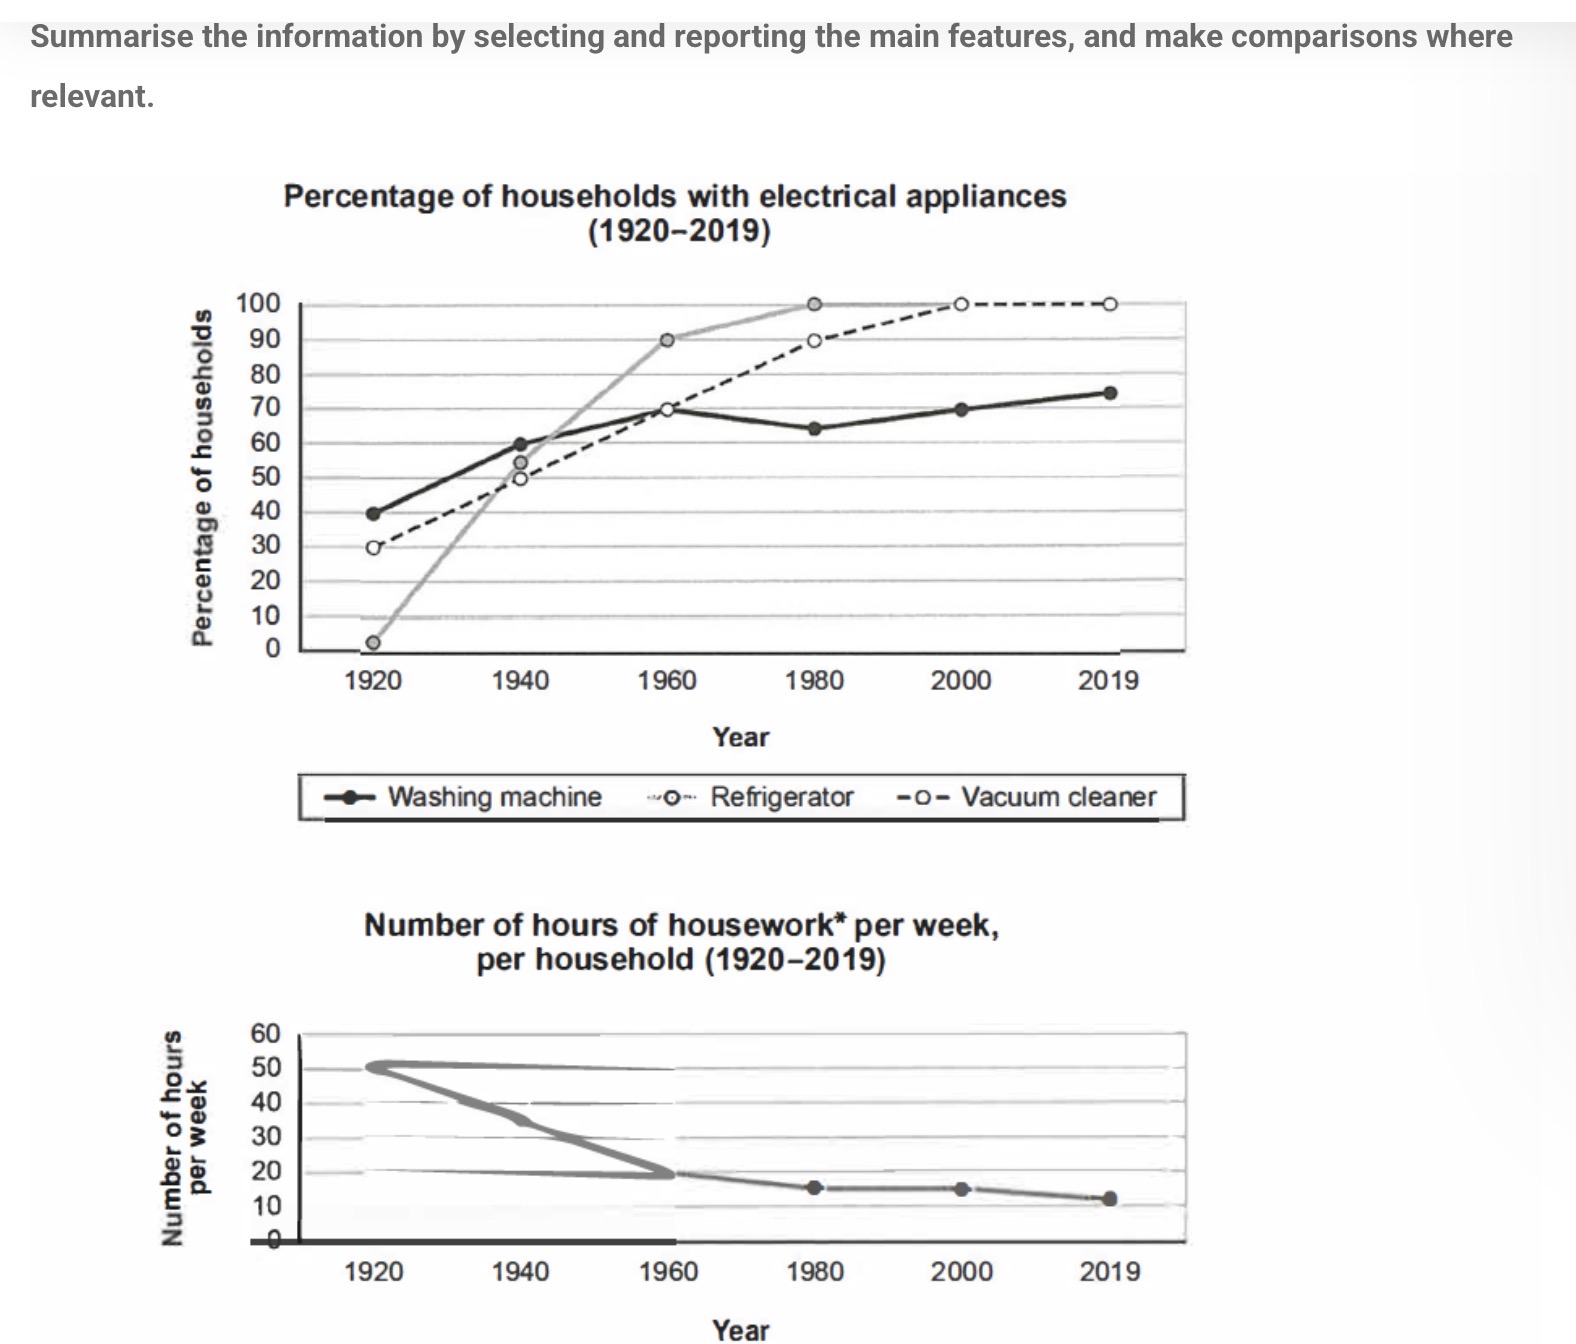
P The line charts illustrates the figure for households with electrical appliances and the time spent doing housework per week, per household in a certain nation between 1920 and 2019. Overall, it can be seen that at the end of the period, refrigerators and vacuum cleaners were the most popular. While an increasing trend can be seen in the percentage of households with electrical appliances, the opposite was true for the time spent doing housework. Looking at the charts more closely, almost no household owned a refrigerator in 1920. The figure for fridge owners rose dramatically in the next 40 years, standing at 90% in 1960. From 1980 on, every household owned a fridge. Unlike the proportion of fridge-owning household, the percentage of vacuum cleaner owners was 30% in 1920. A stable, upward trend was seen in the percentage of vacuum cleaner-owning families, increasing by approximately 20% every 20 years. Eventually, the vacuum cleaner was owned by everyone in 2000 and stayed the same in the next 19 years. On the other hand, while the percentage of washing machine owners was the highest initially, it experienced a smaller growth to 70% in 1960 and remained quite stable until the end of the period. Regarding the second chart, the time spent doing housework per week was 50 hours in 1920, the figure plunged to about 15 hours in 1980, then marginally dipped to just more than 10 hours in 2019
Detail Sampel
The charts below show the changes in ownership of electrical appliances and amount of time spent doing housework in households in one country between 1920 and 2019. Summarise the information by selecting and reporting the main features, and make comparisons where relevant.
20/07/2026 04:38 7.0 skor
Topik
The charts below show the changes in ownership of electrical appliances and amount of time spent doing housework in households in one country between 1920 and 2019. Summarise the information by selecting and reporting the main features, and make comparisons where relevant.
Jumlah kata: 239
Grafik/Diagram
Essay
Skor Keseluruhan
7.0±0.5
Baik
Skor Kriteria Writing
TA7.0
CC7.0
LR7.0
GRA7.0
Klik teks yang ditandai di esai untuk melihat saran detail untuk peningkatan.
Analisis mendalam
Task 1 - Academic Writing
4 tools available
Esai contoh - IELTS Writing Task 1
Belum ada esai contoh
Silakan klik tombol di bawah untuk menganalisis dan membuat esai contoh berkualitas tinggi untuk Task 1.