
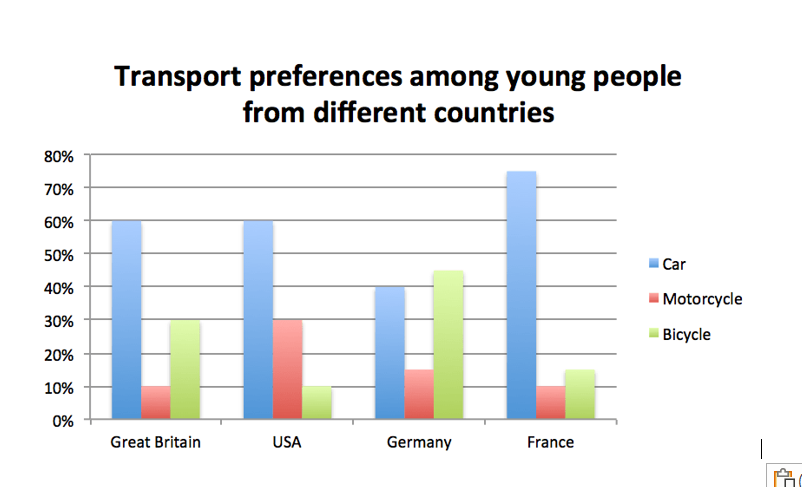
The bar chart illustrates the percentage of young people who prefer cars, motorcycles and bicycles in four countries. Overall, cars are the most popular means of transport among young people in the four countries, especially in France. While motorcycles have the lowest percentages, bicycles are more popular in Germany and Great Britain than in the USA and France. Focusing on cars and motorcycles, cars are always the most popular means of transport in all four countries. The percentages of young people choosing cars in Great Britain, the USA, Germany and France are 60%, 60%, 40% and 75%, respectively. By contrast, motorcycles have much lower percentages than cars. The USA ranks first and accounts for 30%, followed by Germany at 15%, while Great Britain and France record the lowest percentages, at around 10% each. Regarding bicycles, the percentage of young people choosing bicycles in Germany stands at 45%, which is the highest among the four countries. This is followed by Great Britain at 30%, while France accounts for around 15% and the USA records the lowest percentage at just over 10%.
Detail Sampel
The two line graphs show the changes in UK steel demand and employment in the steel industry between 1970 and 2000. Summarise the information by selecting and reporting the main features, and make comparisons where relevant.
20/07/2026 05:19 6.5 skor
Topik
The two line graphs show the changes in UK steel demand and employment in the steel industry between 1970 and 2000. Summarise the information by selecting and reporting the main features, and make comparisons where relevant.
Jumlah kata: 180
Grafik/Diagram
Essay
Skor Keseluruhan
6.5±0.5
Cukup
Skor Kriteria Writing
TA6.0
CC7.0
LR6.0
GRA7.0
Klik teks yang ditandai di esai untuk melihat saran detail untuk peningkatan.
Analisis mendalam
Task 1 - Academic Writing
4 tools available
Esai contoh - IELTS Writing Task 1
Belum ada esai contoh
Silakan klik tombol di bawah untuk menganalisis dan membuat esai contoh berkualitas tinggi untuk Task 1.