
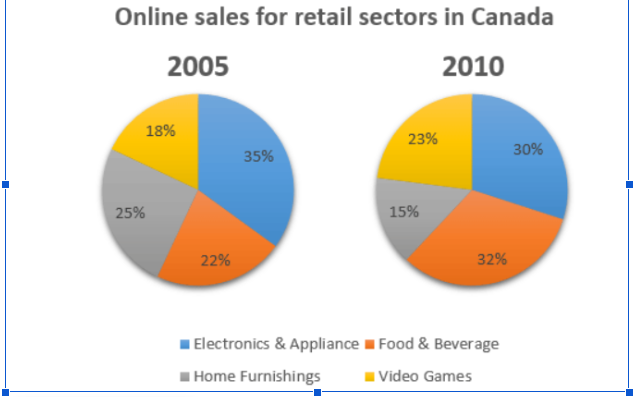
The 2 pie chart illustrates sales of cyber shopping for electronics and appliance, food and beverage, home furnishings and video games in Canada from 2005 to 2010. Overall, while retail of food and video games constituted the upward trend, those percentage of 2 remains decreased. Despite the lowest proportion of video games in 2005, these surpassed others categories and stand with the second highest point at 23 percent. Food and beverage had a similar trend whereas starting with small amount of shopping discount and dominated at 32 percent at the end. This categories increased sharply from 22 percent to 32 percent while the amount of video games just increased approximately by 5 percent from the previous data. In surveyed period, home furnishings and electronics stand with highest and second largest position but 25 percent and 35 percent respectively. However. those declined slightly around 5 percent to 10 percent each categories and become lowest figure of retailed sales in 2010.
รายละเอียดตัวอย่าง
You should spend about 20 minutes on this task. The two pie charts below show the online shopping sales for retail sectors in Canada in 2005 and 2010. Summarise the information by selecting and reporting the main features, and make comparisons where relevant. You should write at least 150 words.
20/07/2026 09:35 5.5 คะแนน
หัวข้อ
You should spend about 20 minutes on this task. The two pie charts below show the online shopping sales for retail sectors in Canada in 2005 and 2010. Summarise the information by selecting and reporting the main features, and make comparisons where relevant. You should write at least 150 words.
จำนวนคำ: 159
แผนภูมิ/กราฟ
Essay
คะแนนรวม
5.5±0.5
พื้นฐาน
คะแนนเกณฑ์การเขียน
TA6.0
CC6.0
LR5.0
GRA5.0
คลิกข้อความที่ไฮไลต์ในเรียงความเพื่อดูคำแนะนำรายละเอียดเพื่อพัฒนา
การวิเคราะห์เชิงลึก
Task 1 - Academic Writing
4 tools available
บทความตัวอย่าง - IELTS Writing Task 1
ยังไม่มีบทความตัวอย่าง
กดปุ่มด้านล่างเพื่อวิเคราะห์และสร้างบทความตัวอย่างคุณภาพสูงสำหรับ Task 1