
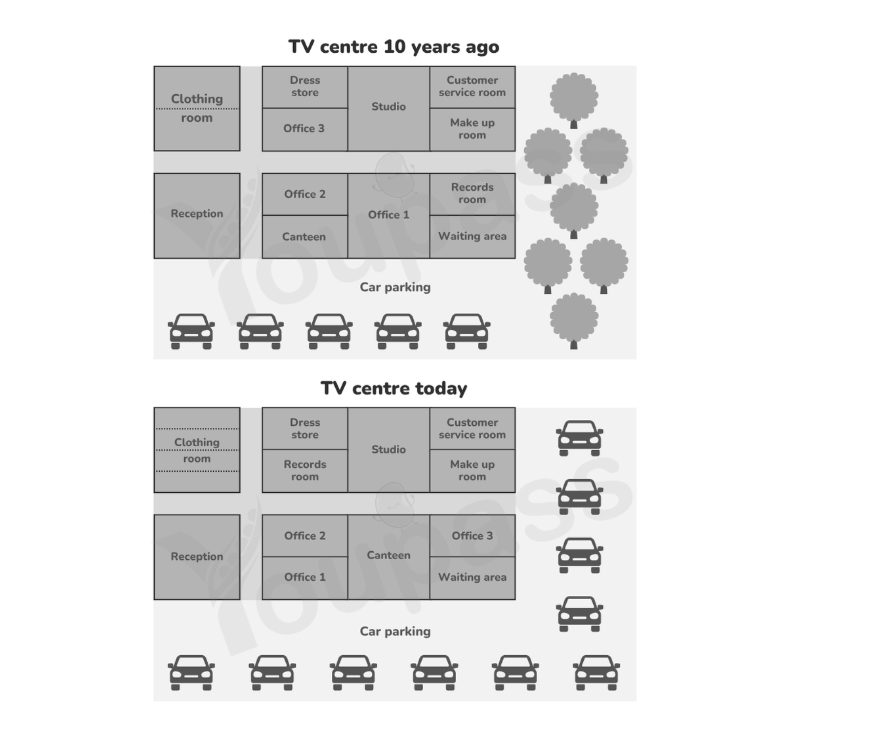
The maps illustrate how the TV centre changed significantly from 10 years ago to now. Overall, it is clear that the TV centre witnessed substantial transformations with the most noticeable changes being replacement of green space with parking area. In addition, various rooms will be converted into other spaces, such as the studio and the reposition of some offices. Ten years ago, there was a wooded green area in the eastern side of the map and the large parking area allocated in the southern. In addition, there were numerous rooms that were developed for various functions. To the right-hand side of the map, there were two clothing rooms and a reception space on the opposite side. The studio is allocated in the middle of the building, with the dress shop and office 3 on the left-side and a customer service and make-up area on the remaining side. Office 1 was built in the middle and office 2 and the canteen were constructed on the right-hand and some functional rooms such as the records room and waiting area were developed in the eastern side. As for the TV centre nowadays, it is obvious that the green area was replaced by a parking zone that occupied the southern and eastern side of the new map. The clothing room was separated into smaller rooms for functional purposes while the reception remains unchanged. As for the top building, office 3 was converted into a records room while other space stayed without changes. The remaining building also witnessed substantial modernizations, the canteen was replaced by office 1, while the canteen was developed more bigger in the middle of the map. Other spaces were redeveloped with a new office 3 and waiting area.
Sample Detail
The two maps below show the TV centre ten years ago and now. Summarize the information by selecting and reporting the main features and make comparisons where relevant.
20/07/2026 05:29 5.5 points
Topic
The two maps below show the TV centre ten years ago and now. Summarize the information by selecting and reporting the main features and make comparisons where relevant.
Word count: 287
Chart/Graph
Essay
Overall Scores
5.5±0.5
Basic
Writing Criteria Scores
TA5.0
CC6.0
LR6.0
GRA6.0
Click on any highlighted text in the essay to view detailed suggestions for improvement.
Deep Analysis
Task 1 - Academic Writing
4 tools available
Sample Essay - IELTS Writing Task 1
No sample essay
Click the button below to analyze and generate a high-quality sample essay for Task 1.