
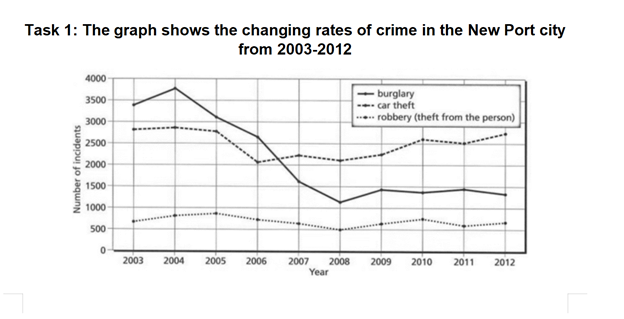
The line graph illustrates then changes of the number in three types of crime in Newport city from 2003 to 2012. Overall, burglary decreased hardly during the period, while car theft just changed slightly and became the most common crime in 2012. Robbery remained the least common type of crime throughout the years. In 2003, burglary had the highest number about 3,400 cases. Then it rose to around 3,700 in 2004 before falling steadily to nearly 1,100 in 2008. After that, it increased slightly and finished at about 1,300 in 2012. Car theft started at around 2,800in 2003. The number quite remained until 2005, then dropped to around 2,000 in 2006. However, it increased and reached roughly 2,700 cases by 2012, becoming the highest figure amongs the three crimes. Robbery was much lower than the other crimes. It rose slightly from about 700 cases in 2003 to around 900 in 2005, before falling to nearly 500 in 2008. The figure at about 600 incidents in 2012.
নমুনা বিস্তারিত
The graph shows the changing rates of crime in the New Port city from 2003 to 2012
20/07/2026 05:38 6.5 স্কোর
টপিক বা বিষয়
The graph shows the changing rates of crime in the New Port city from 2003 to 2012
শব্দ সংখ্যা: 166
চার্ট/গ্রাফ
Essay
সামগ্রিক স্কোর
6.5±0.5
মোটামুটি
রাইটিং মানদণ্ড স্কোর
TA7.0
CC7.0
LR6.0
GRA6.0
উন্নতির জন্য বিস্তারিত পরামর্শ দেখতে প্রবন্ধের হাইলাইট করা যেকোনো লেখায় ক্লিক করুন।
গভীর বিশ্লেষণ
Task 1 - Academic Writing
4 tools available
নমুনা রচনা - IELTS Writing Task 1
কোনো নমুনা রচনা নেই
টাস্ক ১-এর জন্য উচ্চমানের নমুনা রচনা বিশ্লেষণ এবং তৈরি করতে নিচের বাটনে ক্লিক করুন।