
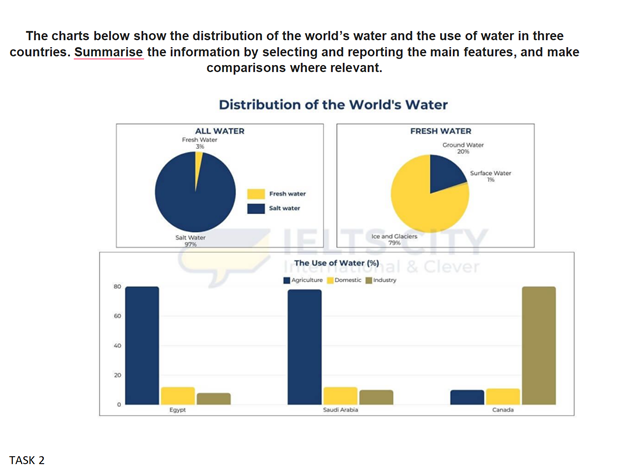
The charts show the distribution of the world’s water and how water is used in Egypt, Saudi Arabia and Canada. Overall, most of the world’s water is salt water, other side only a very small amount is fresh water. In addition, agriculture uses the largest proportion of water in Egypt and Saudi Arabia, meanwhile industry is the main user in Canada. According to the first pie chart, salt water makes up 97% of all water on Earth, while fresh water accounts for only 3%. The second chart shows that most fresh water is stored in ice and glaciers, at 79%. Ground water represents 20%, while only 1% is surface water. Regarding water use, Egypt and Saudi Arabia have them same. In both countries, around 80% of water is used for agriculture. Domestic use is much lower, at about 10–12%, while industry uses the smallest proportion, at around 7–10%. In contrast, Canada uses most of its water for industry, at about 80%. Agriculture and domestic use are both much lower, each accounting for around 10%.
Sample Detail
The chart below show the distribution on the world's water and the use water in three countries.
20/07/2026 05:53 7.0 points
Topic
The chart below show the distribution on the world's water and the use water in three countries.
Word count: 174
Chart/Graph
Essay
Overall Scores
7.0±0.5
Good
Writing Criteria Scores
TA7.0
CC7.0
LR7.0
GRA7.0
Click on any highlighted text in the essay to view detailed suggestions for improvement.
Deep Analysis
Task 1 - Academic Writing
4 tools available
Sample Essay - IELTS Writing Task 1
No sample essay
Click the button below to analyze and generate a high-quality sample essay for Task 1.