
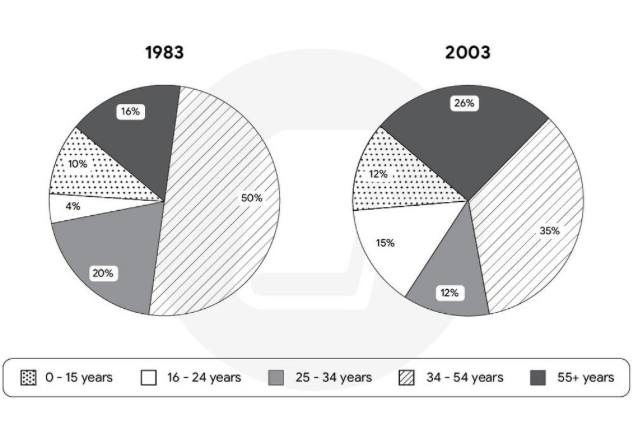
The two pie charts illustrates change in the proportion of Spanish arrivals from the UK in 1983 and 2003, classified by age groups. In general, the percentages of tourists in 25 - 34 and 34 - 54 age groups experienced downward trends, whereas those in other age brackets witnessed upward trends. Moreover, the figure for tourists aged 34 - 54 remained the highest of all categories. In 1983, the percentage of Spanish arrivals from the UK who were aged 34 - 54 stood at 50%, compared to 20% for the 25-34 age group. By 2003, these figures dropped noticeably to 35% and 12%, respectively. Meanwhile, the proportion of visitors among 0 - 15 age bracket witnessed a slight rise from 10% to 12%, the same level as the figure for the 25 - 34 age group. In terms of other categories, all these figures underwent increases at different paces. In particular, the percentage of Spanish arrivals aged over 55 went up from 16% in 1983 to 26% in 2003. During the same timeframe, the figure for visitors within the 16 - 24 age bracket rose significantly from 4%, the lowest of all categories in 1983, to 15% in 2003, occupying the third position.
Sample Detail
The graphs below show the age of visitors from the UK to Spain in 1983 and 2003. Provide an overview of the information by identifying and describing the key details, and include comparisons where appropriate.
20/07/2026 05:56 8.0 points
Topic
The graphs below show the age of visitors from the UK to Spain in 1983 and 2003. Provide an overview of the information by identifying and describing the key details, and include comparisons where appropriate.
Word count: 203
Chart/Graph
Essay
Overall Scores
8.0±0.5
Excellent
Writing Criteria Scores
TA8.0
CC8.0
LR8.0
GRA8.0
Click on any highlighted text in the essay to view detailed suggestions for improvement.
Deep Analysis
Task 1 - Academic Writing
4 tools available
Sample Essay - IELTS Writing Task 1
No sample essay
Click the button below to analyze and generate a high-quality sample essay for Task 1.