
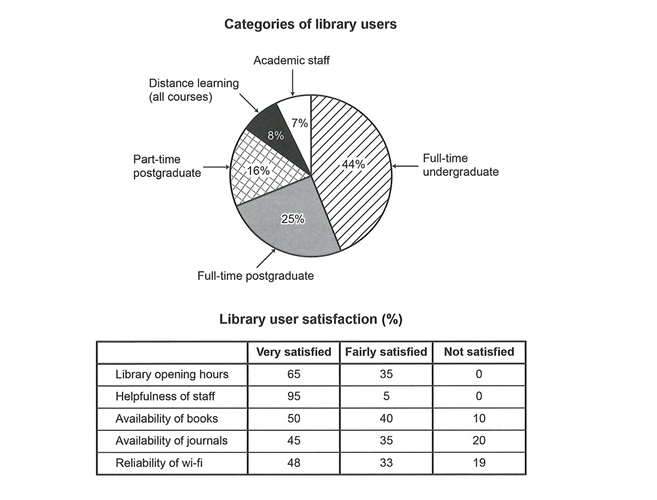
The given pie chart illustrates the categories of library users, and their satisfaction is shown in the table, with figures given in percentages. Overall, while the figure for full-time undergraduates accounts for the majority in the pie chart, that of academic staff is only a minority. As for the table, its highest figure is the users’ high satisfaction in the staff’s helpfulness, while the figures for journal availability and wi-fi reliability draw the highest level of dissatisfaction. In the first graph, whereas the full-time undergraduate group is the predominant one, with 44% of users, academic staff accounts for only 7 % and the distance learning group is 8%, representing their similarly low popularity compared to others. By contrast, full-time postgraduates and their part-time counterparts show little disparity in proportions, with 16% in part-time postgraduates and 25% in full-time postgraduates. Regarding the table, the staff’s helpfulness successfully managed to satisfy the library users, with 95% of them giving very satisfied feedback and no dissatisfied feedback received. Conversely, the figures for journal availability and wi-fi reliability show similarities in making users displeased, with 20% dissatisfied feedback for the availability of journals and 19% for wi-fi reliability.
Sample Detail
The chart and table below show the results of a survey of library users at a university. Summarise the information by selecting and reporting the main features, and make comparisons where relevant.
20/07/2026 06:10 7.0 points
Topic
The chart and table below show the results of a survey of library users at a university. Summarise the information by selecting and reporting the main features, and make comparisons where relevant.
Word count: 194
Chart/Graph
Essay
Overall Scores
7.0±0.5
Good
Writing Criteria Scores
TA7.0
CC7.0
LR7.0
GRA7.0
Click on any highlighted text in the essay to view detailed suggestions for improvement.
Deep Analysis
Task 1 - Academic Writing
4 tools available
Sample Essay - IELTS Writing Task 1
No sample essay
Click the button below to analyze and generate a high-quality sample essay for Task 1.