
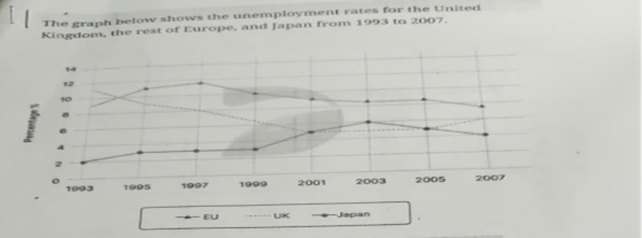
The line graph illustrated the percentage of unemployed people in the UK, the rest of Europe, and Japan between 1993 and 2007. Overall, the UK and Europe showed downward trend in unemployment, while Japan saw an increase over a period. Beside, European countries had nearly the highest rates in 1993 when the UK held the top at first. In 1993, the UK had the highest unemployment rate at 11%, followed by Europe at 9%. Japan started with the lowest only 2%, which was nearly four times lower than that of the UK. However, the UK’s rate downed dramaticlly to 5% by 2001. Until 2005, it rose slightly to 6% in 2007. Europe’s unemployment rate reached a peak at 12% in 1997 before decreased to 7% by 2007. Beside that, it still remained the highest among the three regions. In contrast, Japan saw opposite, its unemployment rate increased gradually to reach 6% in 2003, before falling to 4% in 2007.
Detail Sampel
The graph below shows the unemployment rates for the United Kingdom, the rest of Europe and Jaapan from 1993 to 2007
20/07/2026 06:22 5.0 skor
Topik
The graph below shows the unemployment rates for the United Kingdom, the rest of Europe and Jaapan from 1993 to 2007
Jumlah kata: 159
Grafik/Diagram
Essay
Skor Keseluruhan
5.0±0.5
Dasar
Skor Kriteria Writing
TA5.0
CC6.0
LR5.0
GRA5.0
Klik teks yang ditandai di esai untuk melihat saran detail untuk peningkatan.
Analisis mendalam
Task 1 - Academic Writing
4 tools available
Esai contoh - IELTS Writing Task 1
Belum ada esai contoh
Silakan klik tombol di bawah untuk menganalisis dan membuat esai contoh berkualitas tinggi untuk Task 1.