
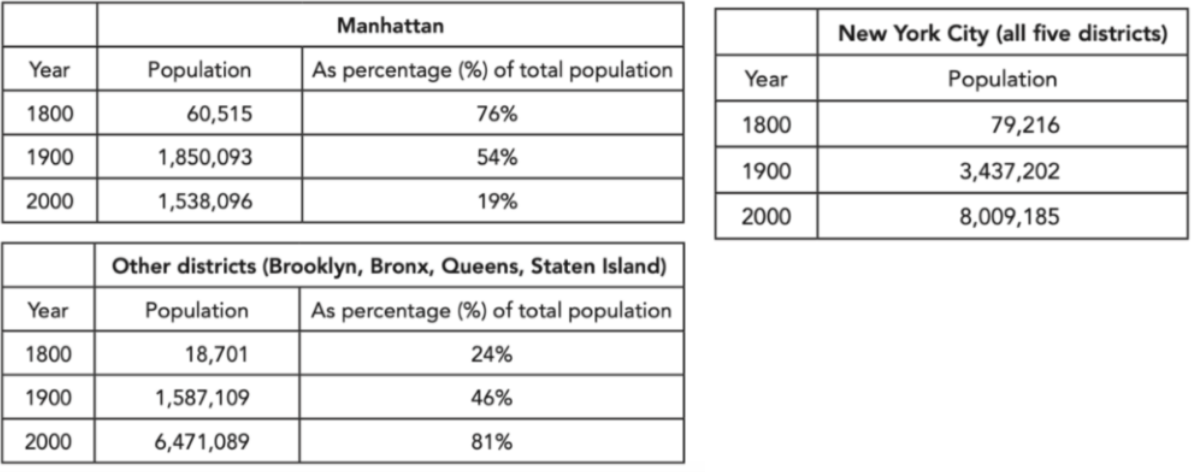
The statistical tables delineate changes in the population of five particular districts of New York City, namely Manhattan, Brooklyn, Bronx, Queens, and Staten Island, over a two-century period between 1800 and 2000. Overall, New York City’s total population witnessed a substantial rise throughout the timeframe. In addition, despite initially accounting for the majority of the city’s residents, Manhattan's percentage shrunk dramatically over time, whereas that of other districts gradually predominated the total population. Regarding the year 1800, it is evident that New York City’s inhabitants were relatively low, at merely 79,216. Manhattan’s population accounted for 76% of the total, at 60,515, followed by that of other districts making up only 24% at 18,701. A century later, the total residents in New York City experienced a fortyfold climb to 3,437,202. Although the overall population increased to 1,850,093, Manhattan’s share declined moderately to 54%. Conversely, the number of inhabitants and percentage of other districts both saw upward trends, with the respective figures of 1,587,109 and 46%. In 2000, New York City’s total number of residents more than doubled compared with 1900, reaching 8,009,185. In spite of dropping marginally to 1,538,096, Manhattan’s population proportion decreased dramatically to 19%. In contrast, the other districts’ residents surged to 6,471,089, with the percentage of 81% of the total share.
Sample Detail
The first table below shows changes in the total population of New York City from 1800 to 2000. The second and third tables show changes in the population of the five districts of the city (Manhattan, Brooklyn, Bronx, Queens, Staten Island) over the same period. Summarise the information by selecting and reporting the main features, and make comparisons where relevant. Write at least 150 words.
20/07/2026 06:36 8.0 points
Topic
The first table below shows changes in the total population of New York City from 1800 to 2000. The second and third tables show changes in the population of the five districts of the city (Manhattan, Brooklyn, Bronx, Queens, Staten Island) over the same period. Summarise the information by selecting and reporting the main features, and make comparisons where relevant. Write at least 150 words.
Word count: 213
Chart/Graph
Essay
Overall Scores
8.0±0.5
Excellent
Writing Criteria Scores
TA8.0
CC8.0
LR8.0
GRA8.0
Click on any highlighted text in the essay to view detailed suggestions for improvement.
Deep Analysis
Task 1 - Academic Writing
4 tools available
Sample Essay - IELTS Writing Task 1
No sample essay
Click the button below to analyze and generate a high-quality sample essay for Task 1.