
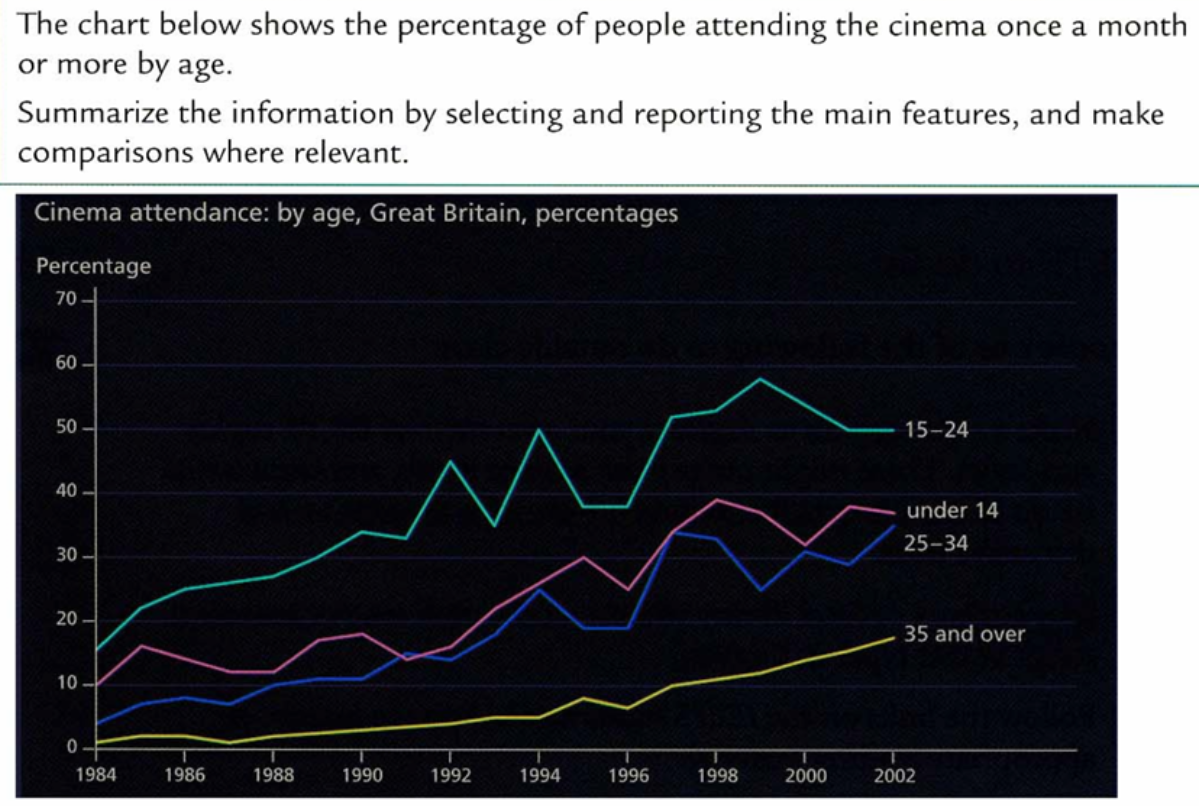
The chart shows cinema attendance by age in percentages. The graph takes the period of time from 1984 to 2002 in Great Britain. Overall, all age groups increase over the given period. At the start of the period, 15-24 was the most attending age category, while 35 and over were the fewest ones. The under 14 and 25-34 groups fluctuated throughout the period, but ultimately, the under 14 group proved to be the more attending one. The highest group was consistently 15-24, beginning with around 15 percentages. This age group fluctuated, peaking at approximately 60 percent, but in due course decreased more than 50 percent in 2002. Likewise, the 25-34 age group started at nearly 5 percent in 1984, after which the figure fluctuated slightly and rose to over 30 percent. While for under 14 and 35 and over, there was also a percentage rise, but it fluctuated less, climbing in a much more uniform and consistent manner. The youngest group had 10 percent in the first years, and then grown to approximately 34 percent in the last year. The oldest one started with around 1 percent in 1984. Then, the number rose by 10 percent in 2002.
Sample Detail
The chart below shows the percentage of people attending the cinema once a month or more by age. Summarize the information by selecting and reporting the main features, and make comparisons where relevant.
20/07/2026 06:37 6.0 points
Topic
The chart below shows the percentage of people attending the cinema once a month or more by age. Summarize the information by selecting and reporting the main features, and make comparisons where relevant.
Word count: 198
Chart/Graph
Essay
Overall Scores
6.0±0.5
Fair
Writing Criteria Scores
TA6.0
CC7.0
LR6.0
GRA6.0
Click on any highlighted text in the essay to view detailed suggestions for improvement.
Deep Analysis
Task 1 - Academic Writing
4 tools available
Sample Essay - IELTS Writing Task 1
No sample essay
Click the button below to analyze and generate a high-quality sample essay for Task 1.