
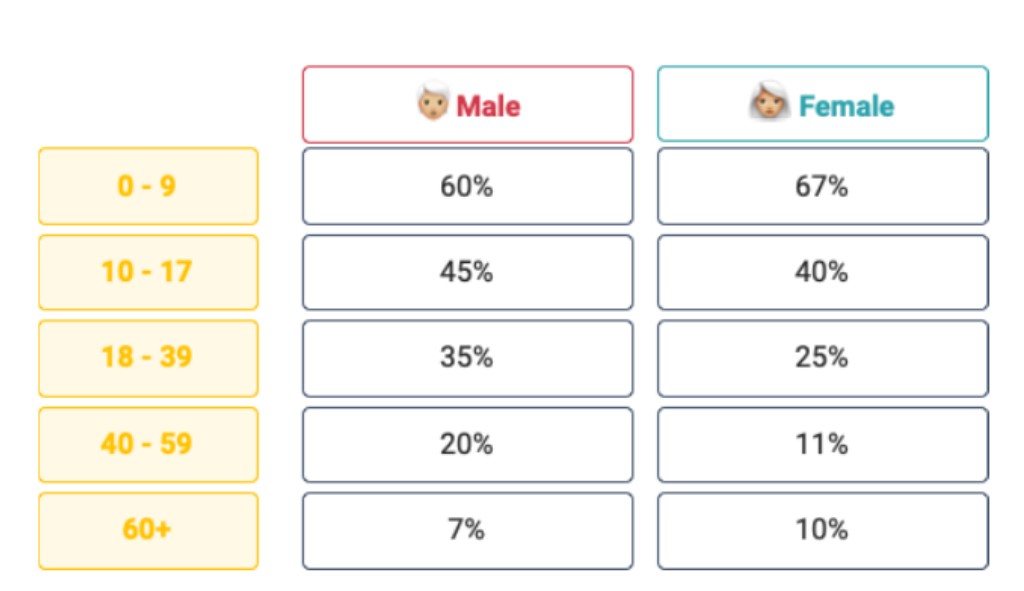
The chart provides information on the proportion of people who took part in swimming in the UK in 2010. Overall, while the under 9 years old group and the 60+ group had more female participants than that of males, the opposite situation could be observed in the remaining groups. Despite this difference, the youngest group had the most swimmers in both figures for males and females. Regarding the under 9 years old group, there were 67% of females, 7% higher than the percentage of males. People aged from 10 to 17 years old exhibited a reverse habit, as the figure for males stood at 45% while that of females was slightly lower, at 40%. Likewise, 35% males between 18 - 39 years old participated in swimming, surpassing the figure for females by 10%. In terms of the 40 - 59 years old group, swimming was opted by 20% of males, which was approximately double females participants. In contrast, there were 10% of female swimmers in the oldest group, exceeding the proportion of males by 3%.
รายละเอียดตัวอย่าง
The table shows the percentage of people who practiced swimming in the UK in 2010.
20/07/2026 07:01 7.0 คะแนน
หัวข้อ
The table shows the percentage of people who practiced swimming in the UK in 2010.
จำนวนคำ: 175
แผนภูมิ/กราฟ
Essay
คะแนนรวม
7.0±0.5
ดีมาก
คะแนนเกณฑ์การเขียน
TA7.0
CC7.0
LR7.0
GRA7.0
คลิกข้อความที่ไฮไลต์ในเรียงความเพื่อดูคำแนะนำรายละเอียดเพื่อพัฒนา
การวิเคราะห์เชิงลึก
Task 1 - Academic Writing
4 tools available
บทความตัวอย่าง - IELTS Writing Task 1
ยังไม่มีบทความตัวอย่าง
กดปุ่มด้านล่างเพื่อวิเคราะห์และสร้างบทความตัวอย่างคุณภาพสูงสำหรับ Task 1